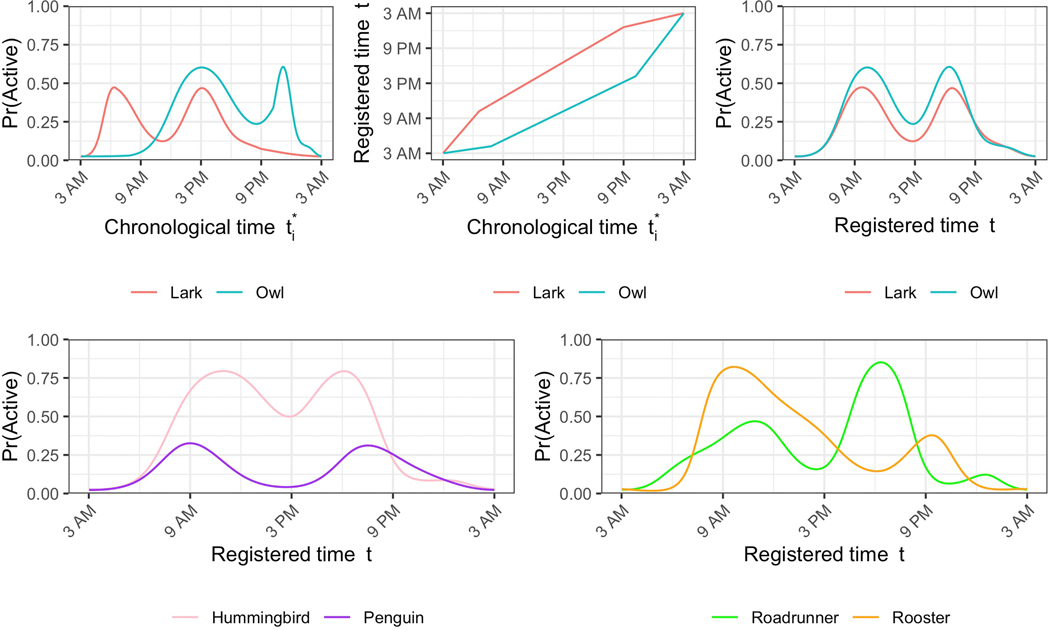
Figure 4.
Simulated activity probability profiles from select chronotypes for demonstration. The top row compares a lark and an owl in terms of their profiles in chronological time (top left), warping functions, (top middle), and profiles in registered time (top right). In the bottom left, the profiles of a hummingbird and a penguin are compared in registered time. In the bottom right, the profiles of a roadrunner and a rooster are compared in registered time. These simulated profiles were generated by specifying warping function parameters and PC scores that meet each chronotype’s definition. We refer the reader to Table 1 for these definitions.

