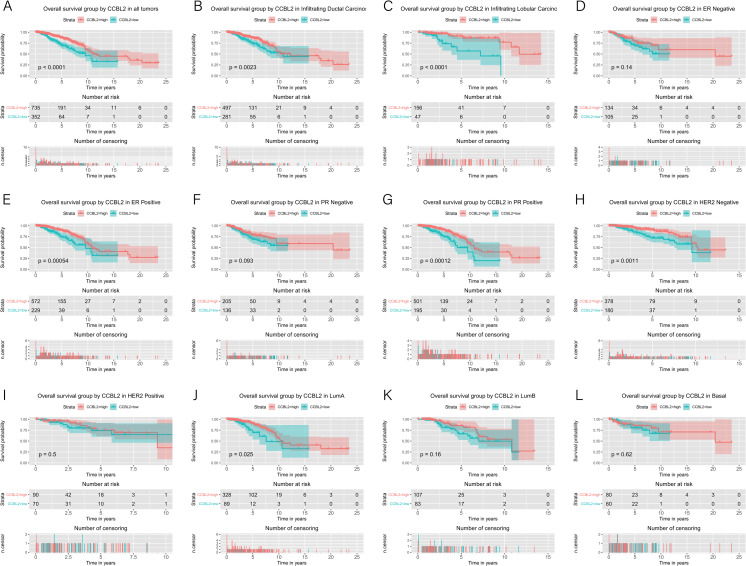
Fig 5. Kaplan–Meier curves of overall survival in breast cancer according to CCBL2 expression in breast cancer tissues.
Overall survival analysis and subgroup analyses of histological type (B and C), ER (D and E), PR (F and G), HER-2 (H and I) and molecular subtype (J, K and L). High CCBL2 expression had relations with the high overall survival. (p < 0.0001) (A).

