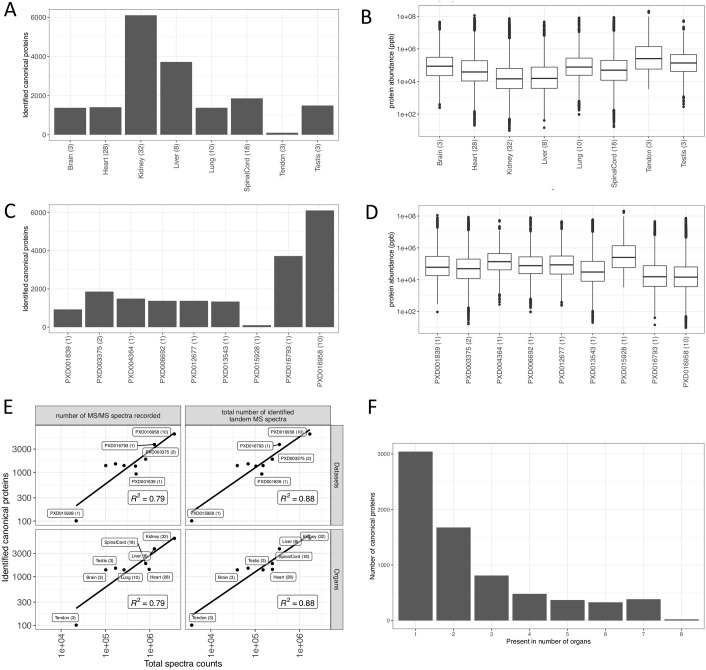
Fig 3.
(A) Number of canonical proteins identified across different rat organs. The number within the parenthesis indicates the number of samples. (B) Range of normalised iBAQ protein abundances across different organs. The number within the parenthesis indicates the number of samples. (C) Canonical proteins identified across different datasets. The number within the parenthesis indicate the number of unique tissues in the dataset. (D) Range of normalised iBAQ protein abundances across different datasets. The number within parenthesis indicate the number of unique tissues in the dataset. (E) Comparison of total spectral data with the number of canonical proteins identified in each dataset and organ. (F) Distribution of canonical proteins identified across organs.

