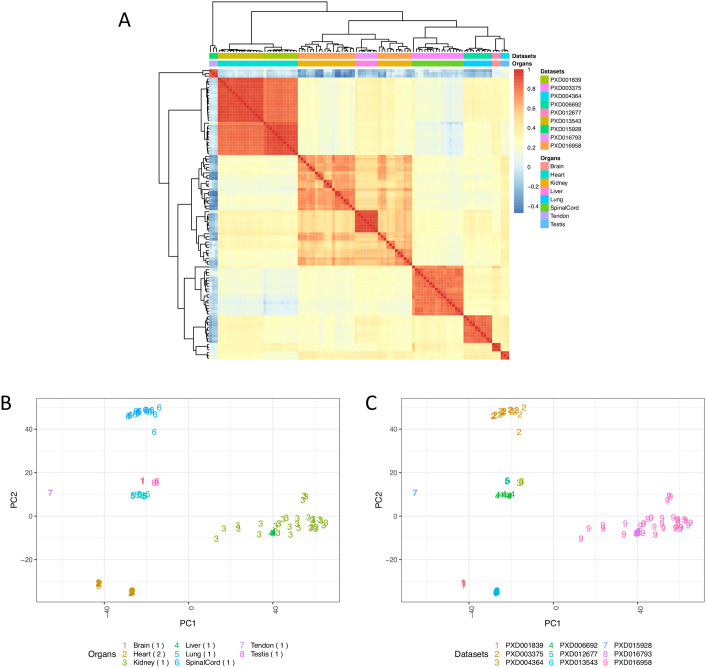
Fig 5.
(A) Heatmap of pairwise Pearson correlation coefficients across all rat samples. The colour represents the correlation coefficient and was calculated using the bin transformed iBAQ values. The samples were hierarchically clustered on columns and rows using Euclidean distances. (B) PCA of all samples coloured by the organ types. (C) PCA of all samples coloured by their respective dataset identifiers. The numbers in parenthesis indicate the number of datasets for each organ. Binned values of canonical proteins quantified in at least 50% of the samples were used to perform the PCA.

