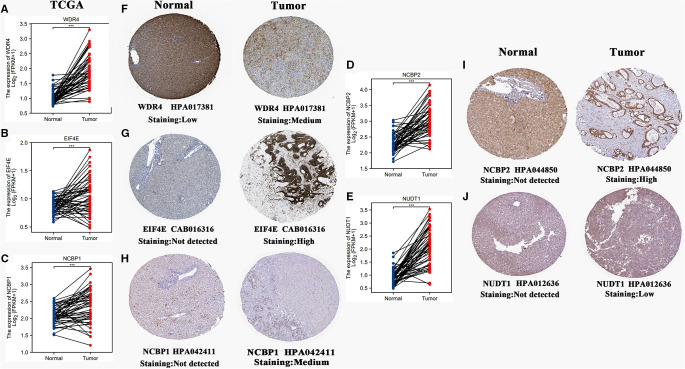
Figure 7.
Histological expressions of five m7G signature genes. (A–E) Differences in mRNA expressions of 5 m7G genes between normal and HCC samples based on the TCGA-LIHC cohort. (F–J) Differences in histological expressions of 5 m7G genes between normal and HCC tissues based on the HPA database. The top of the figure indicates the category of the tissue specimen. The name of the m7G signature gene, the antibody type, and the staining intensity are listed at the bottom of each image. *P < 0.05, **P < 0.01, ***P < 0.001.

