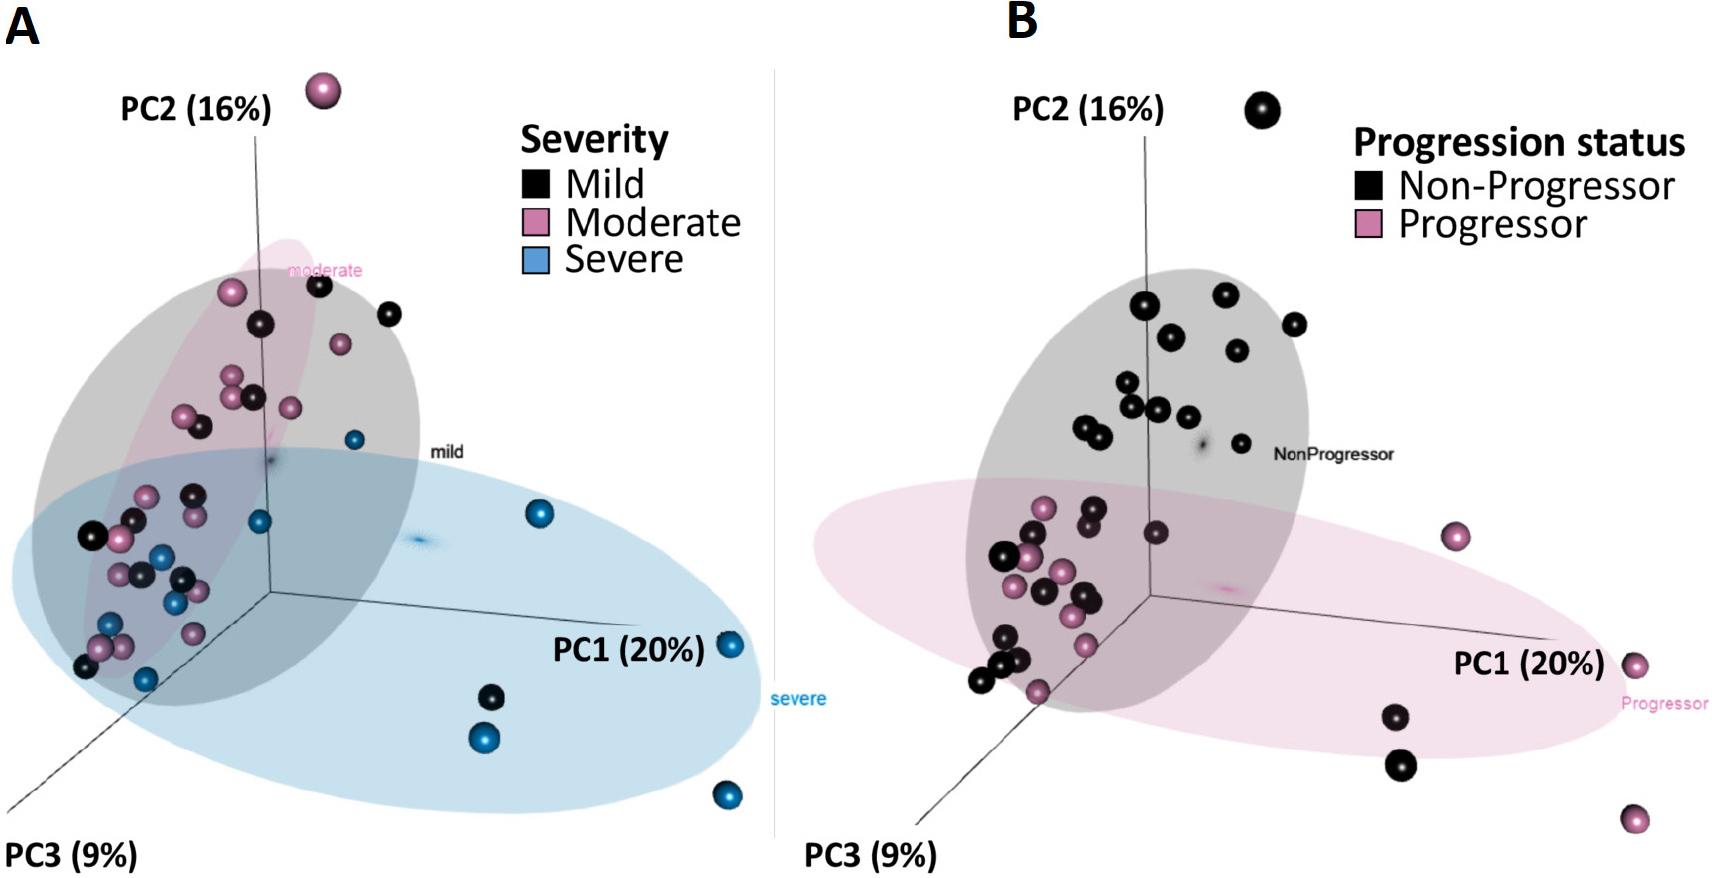
Figure 1. PC analysis of chronic hypersensitivity pneumonitis gene expression data.

Using expression data normalised for sequencing depth, we generated a PC analysis using the top 15% highly variable genes and labelled samples by (A) severity or (B) progression status. Variability in genes was determined using the IQR divided by the median for each gene across samples, a non-parametric analogue to coefficient of variation. Though perfect separation of clusters is not expected when no phenotype information is used for gene selection a priori, the stronger clustering by progression status than by disease severity in this unbiased analysis suggests that the expression data would be a useful predictor of progression. PC, principal component.
