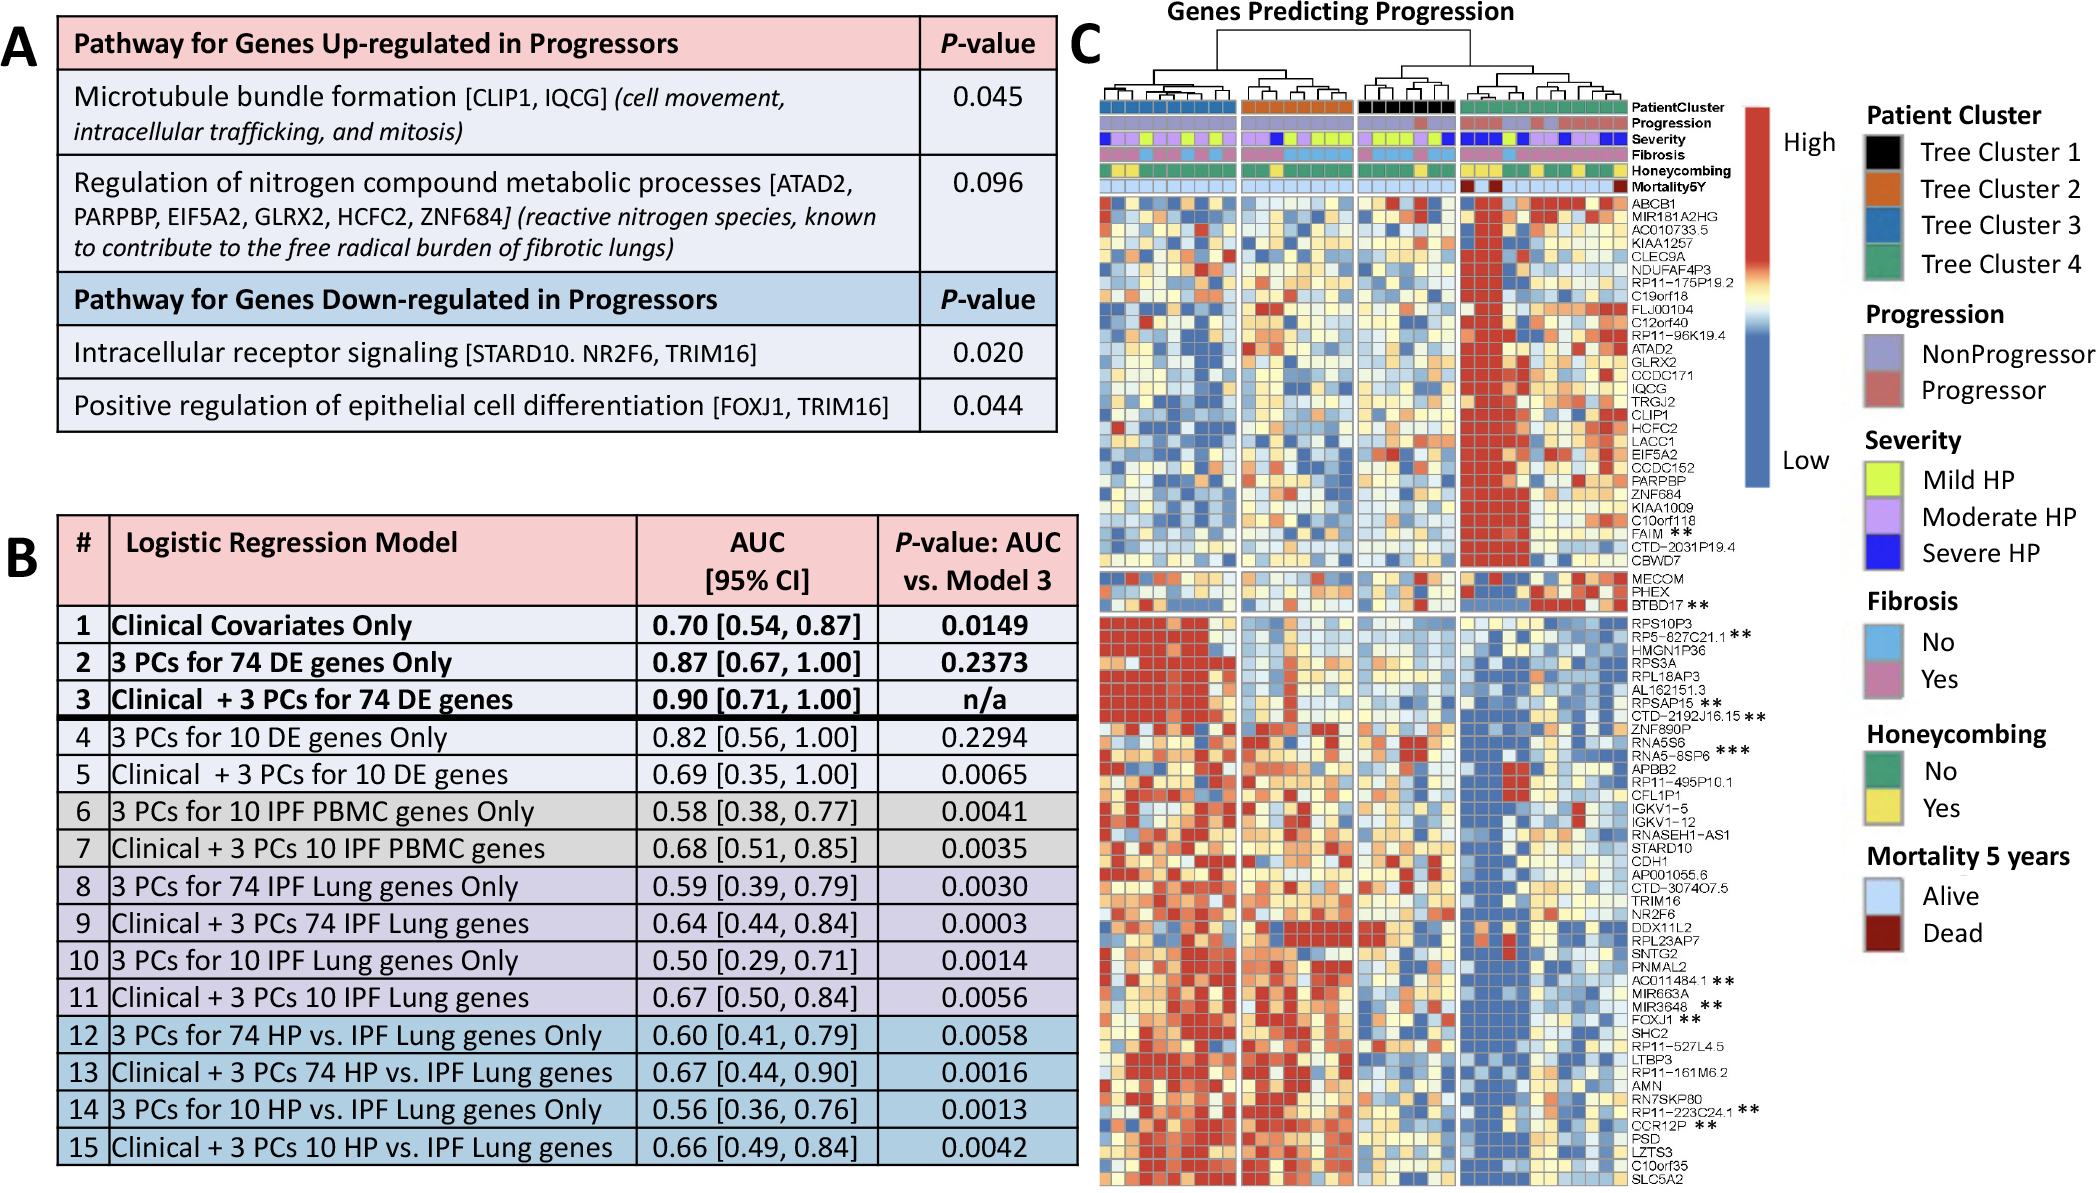
Figure 2. Analyses with differentially expressed genes.

(A) Pathway analysis using gene ontology GO_FAT_BP terms in DAVID (https://david.ncifcrf.gov/). Next to the terms, genes annotated to the term are shown in brackets and the significance of the upregulated genes to HP biology is shown in parentheses. (B) Predictive performance by leave-one-out cross-validation of logistic regression classifiers of progressors versus non-progressors (adjusted for age, gender and smoking status) using only baseline clinical parameters (FVC%, DLCO% and CT presence of fibrosis–reticulation and/or honeycombing); using only expression data; or using clinical data in combination with expression data. Shown is AUC, with 95% CIs in brackets, and the p value for the one-sided Delong test of significant difference (p<0.05) between AUC of a given model and the best AUC among all models. Gene expression data were included in a model using the first three PCs of the data for a given set of genes. Gene sets were either taken from among the 74 DE genes for HP progressors versus non-progressors (all 74 or top 10 by FDR value, models 2–5) or from three published gene signatures of IPF in PBMCs (mild vs severe IPF genes, top 10 genes as in Yang et al6 from their table 5; models 6–7) and lung (IPF vs control, top 74 or 10 genes by p value as in Yang et al7 from their table S2; models 8–11; or HP vs IPF, top 74 or 10 genes by TNoM as in Selman et al8 from their table E2, models 12–15). The original gene signatures varied greatly in size across the IPF studies (from 13 genes to 5465 genes). To make comparisons unbiased by signature size, we used the ranking established by the original authors and considered only the top 74 genes of each, where possible, to be comparable to our signature of size 74, or the top 10, as limited by the smallest signature in IPF PBMCs, where only 10 of the 13 original publication’s genes had data in our dataset (CCDC18-AS1 and the two unnamed transcripts were not used). None of the top 10 or top 74 genes listed in the published signatures were found among our 74 DE genes. Performance for predicting CHP progression using only clinical data (model 1 AUC=0.70) was significantly improved when adding the first three PCs of the 74 DE genes combined with clinical features (model 3 AUC=0.90, Delong one-sided test of the two AUCs p=0.0149). The combined model (model 3) was also a significant improvement over using a signature of just the top 10 DE genes in combination with clinical features (model 5 AUC=0.69; the 10 genes are starred ** in C, only 11th ranked AC011484.1 was not used), or any of the models using genes from published signatures of IPF (all models 6–15 with AUCs ranging from 0.50 to 0.68 had one-sided pairwise Delong tests against model three with p≤0.0065), indicating our 74 DE signature combined with clinical features is specific to predicting CHP progression. The combined model (model 3) was not statistically better than either expression only model, using 74 DE genes (model 2, AUC=0.87, Delong p=0.24) or 10 DE genes (model 4, AUC=0.82, Delong p=0.23), indicating that expression was a major contributor to predictive accuracy. (C) Hierarchical clustering of 74 DE genes (FDR=0.1). Data were scaled per gene (row) to have mean zero and SD 1 and clustered using Ward’s linkage on correlation. Eleven genes were DE at FDR=0.05 (**) and one at FDR=0.01 (***). AUC, area under the curve; CHP, chronic hypersensitivity pneumonitis; DE, differential expression; DLCO, diffusing capacity of the lungs for carbonmonoxide; FDR, false discovery rate; IPF, idiopathic pulmonary fibrosis; PC, principal component.
