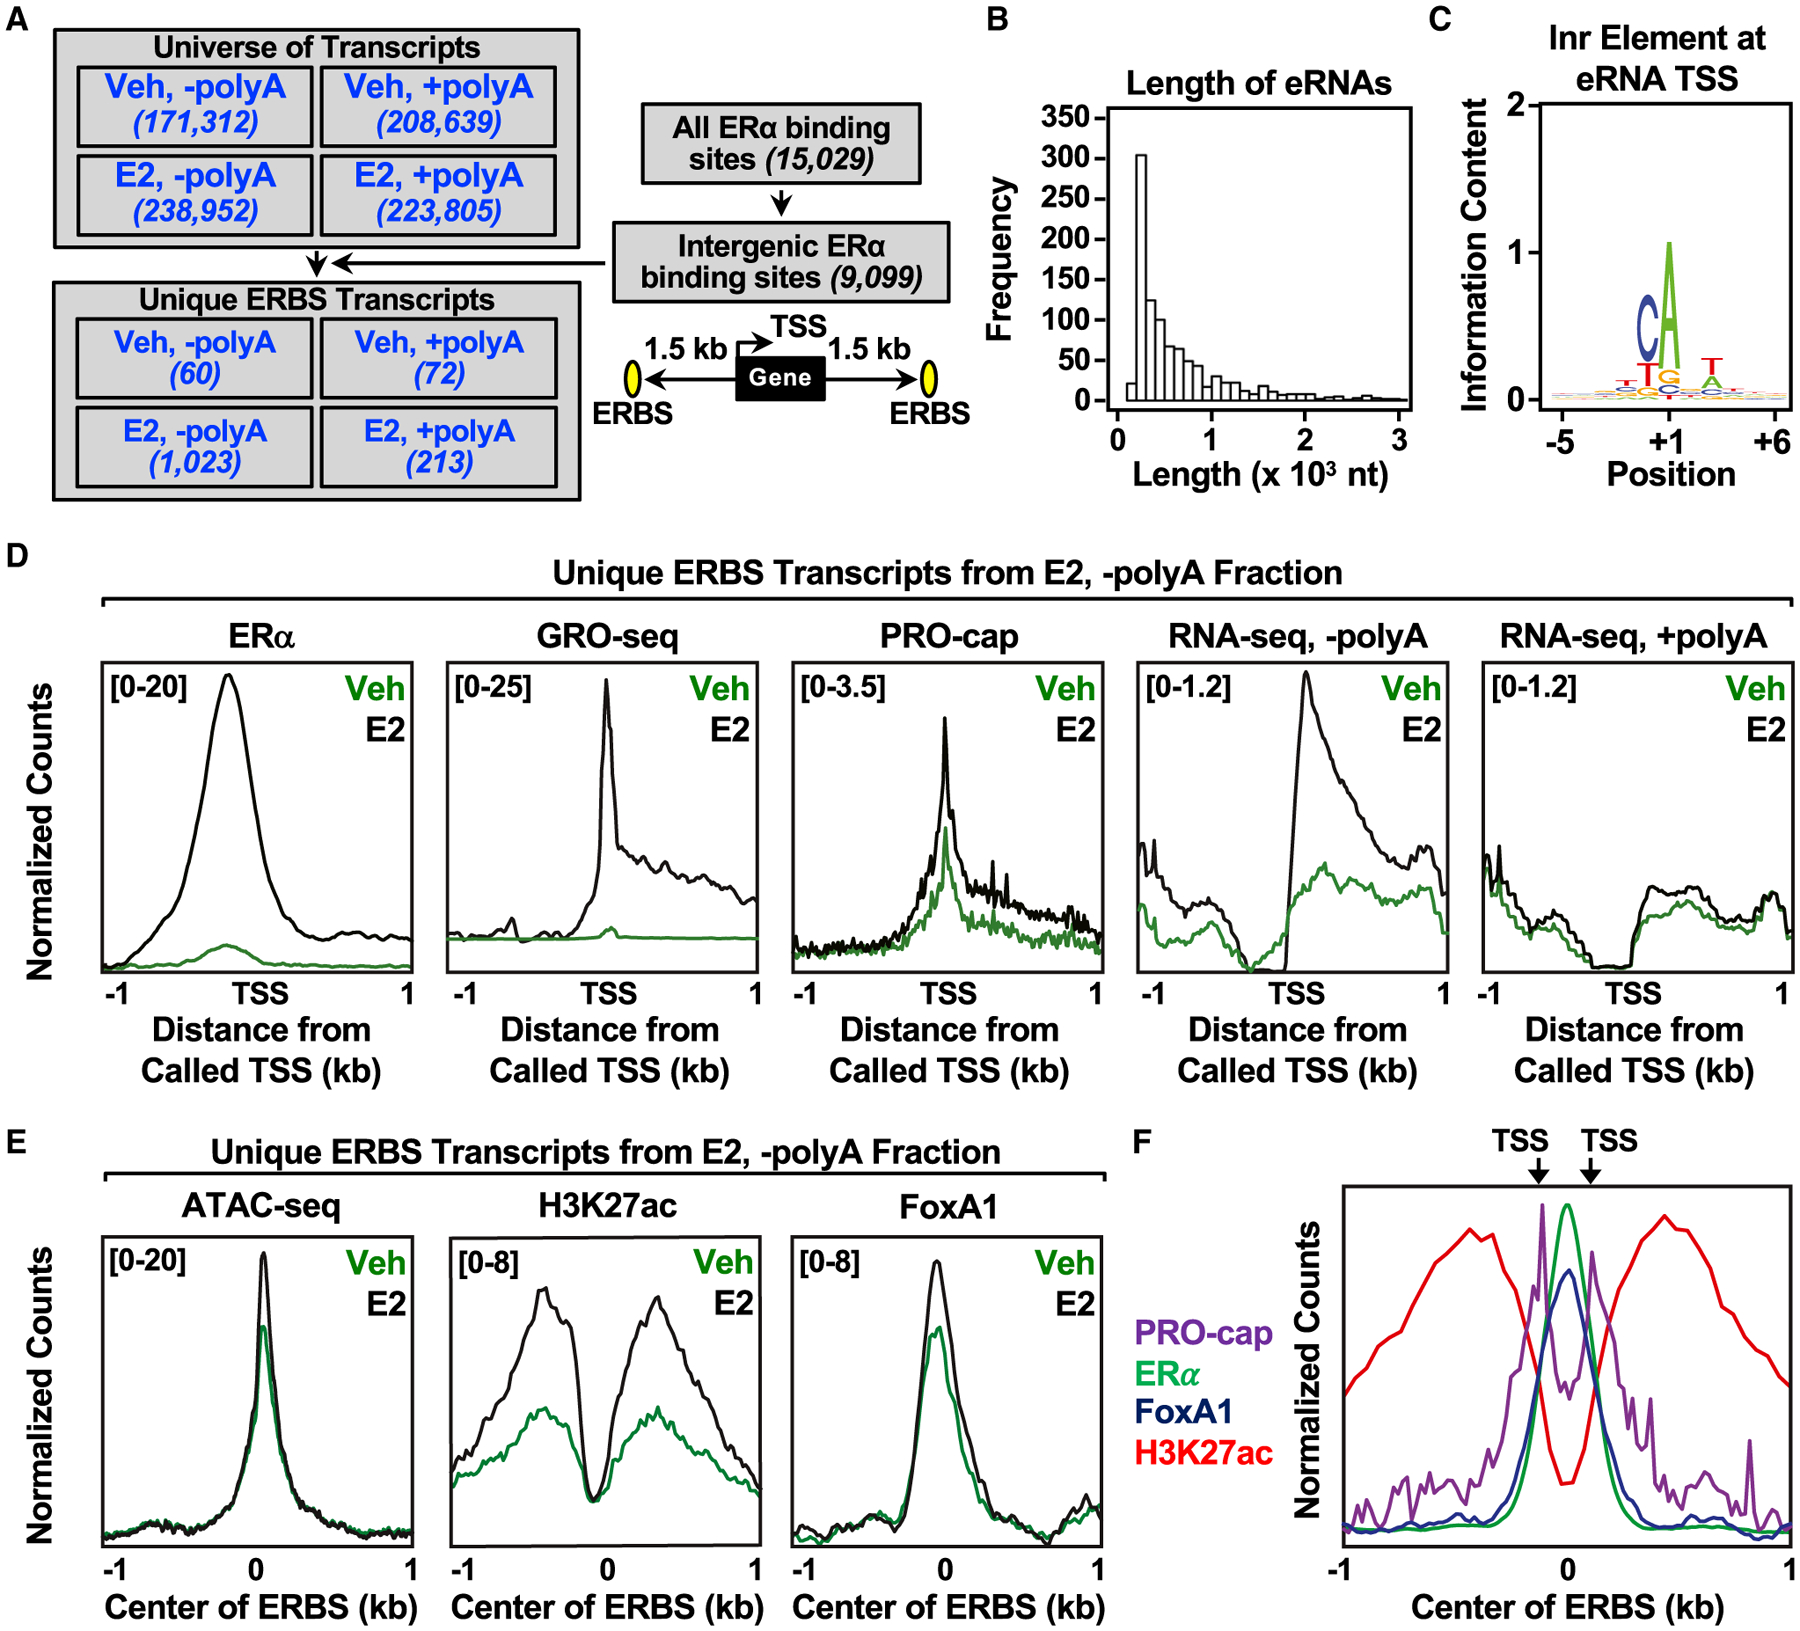
Figure 1. Annotation and characterization of estrogen-regulated eRNAs in MCF-7 cells.

(A) Flowchart illustrating the genomic and computational analysis pipeline used to annotate estrogen-regulated eRNAs using polyA-depleted (−polyA) or polyA-enriched (+polyA) RNA-seq libraries generated from DMSO (Veh) or E2-treated MCF-7 cells.
(B) Histogram of the individual lengths of 1,023 E2-regulated eRNAs.
(C) Position weight matrix of eRNA TSSs determined using PRO-cap reveals the presence of the initiator (Inr) element.
(D) Metagene representations of normalized read counts for ERα ChIP-seq, GRO-seq, PRO-cap, RNA-seq from polyA-depleted (-polyA) fraction, and RNA-seq from polyA-enriched (+polyA) fraction around the TSSs (±1 kb) of 1,023 estrogen-regulated eRNAs from DMSO (vehicle [Veh]) or E2-treated MCF-7 cells. Antisense eRNAs were oriented the same way as the sense eRNAs.
(E) Metagene representations of average read counts for ATAC-seq, H3K27 ac, and FoxA1 ChIP-seq around the ERα binding site (ERBS) of 1,023 estrogen-regulated eRNAs from Veh or E2-treated MCF-7 cells. Antisense eRNAs were not oriented the same way as the sense eRNAs.
(F) Overlaid metagene representations of PRO-cap, ERα, FoxA1, and H3K27ac ChIP-seq from E2-treated MCF-7 cells to depict bidirectional transcription of E2-regulated eRNAs around the center of the ERBS (±1 kb). TSSs determined by PRO-cap are indicated by arrows. All genomic assays represented in this figure were performed as two biological and two technical replicates.
See also Figures S1 and S2.
