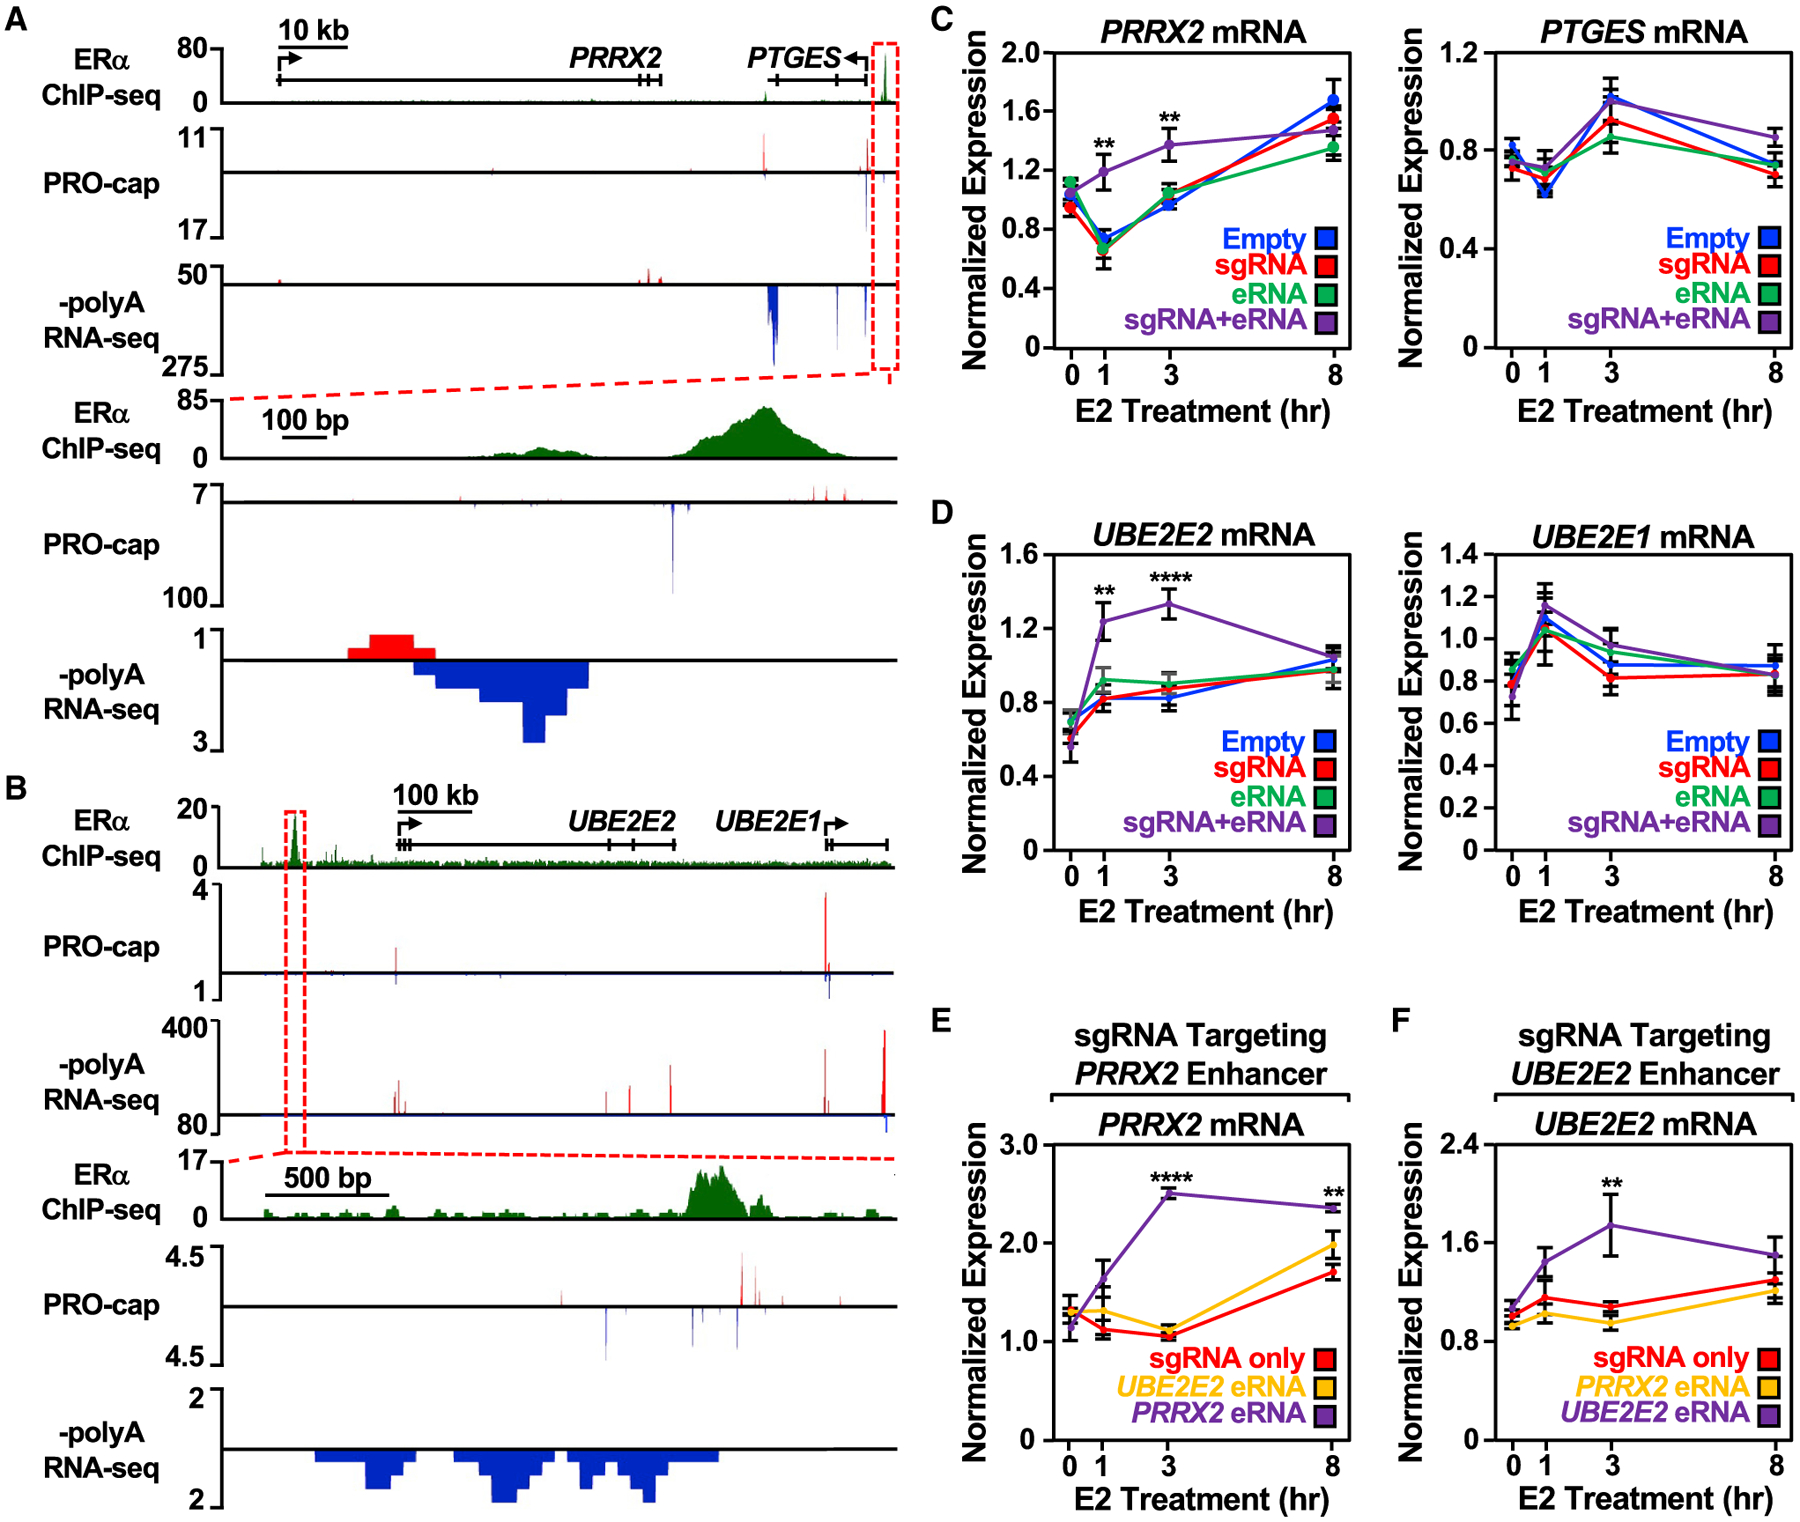
Figure 3. Targeting an estrogen-regulated eRNA to its enhancer of origin using CRISPR-dCas9 modulates target gene expression.

(A and B) Genome browser views of the (A) PRRX2-PTGES and (B) UBE2E2-UBE2E1 topologically associating domains (TADs). A zoomed-in view of the ERα enhancer (boxed region) is included at the bottom.
(C) Reverse transcription-quantitative PCR (RT-qPCR) analysis of the PRRX2 (left) and PTGES (right) mRNA levels normalized to GAPDH mRNA levels in dCas9-expressing MCF-7 cells with PRRX2 sgRNA, eRNA, and sgRNA + eRNA constructs. Cells were treated with E2 for the indicated time. Each point represents the mean ± standard error of the mean (n = 3 biological/technical replicates). Asterisks indicate significant differences from the corresponding empty control (two-way ANOVA, Fisher’s least significant difference post hoc test, *p < 0.05, **p < 0.01, ****p < 0.0001).
(D) RT-qPCR analysis of the UBE2E2 (left) and UBE2E1 (right) mRNA levels normalized to GAPDH mRNA levels in dCas9-expressing MCF-7 cells with UBE2E2 sgRNA, eRNA, and sgRNA + eRNA constructs. Cells were treated with E2 for the indicated time. Each point represents the mean ± standard error of the mean (n = 4 biological/technical replicates). Asterisks indicate significant differences from the corresponding empty control (two-way ANOVA, Fisher’s least significant difference post hoc test, *p < 0.05, **p < 0.01, ****p < 0.0001).
(E) RT-qPCR analysis of the PRRX2 mRNA expression level normalized to GAPDH mRNA levels in dCas9-expressing MCF-7 cells with PRRX2 sgRNA, sgRNA fused to UBE2E2 eRNA, or sgRNA fused to its cognate PRRX2 eRNA (PRRX2 eRNA, purple). Cells were treated with E2 for the indicated time. Each point represents the mean ± standard error of the mean (n = 3 biological/technical replicates). Asterisks indicate significant differences from the corresponding control (two-way ANOVA, Fisher’s least significant difference post hoc test, *p < 0.05, **p < 0.01, ****p < 0.0001).
(F) RT-qPCR analysis of the UBE2E2 mRNA expression level normalized to GAPDH mRNA levels in dCas9-expressing MCF-7 cells with UBE2E2 sgRNA, sgRNA fused to PRRX2 eRNA, or sgRNA fused to its cognate UBE2E2 eRNA. Cells were treated with E2 for the indicated time. Each point represents the mean ± standard error of the mean from four independent biological and technical replicates. The asterisks indicate significant differences from the corresponding control (two-way ANOVA, Fisher’s least significant difference post hoc test, *p < 0.05, **p < 0.01, ****p < 0.0001).
See also Figure S3.
