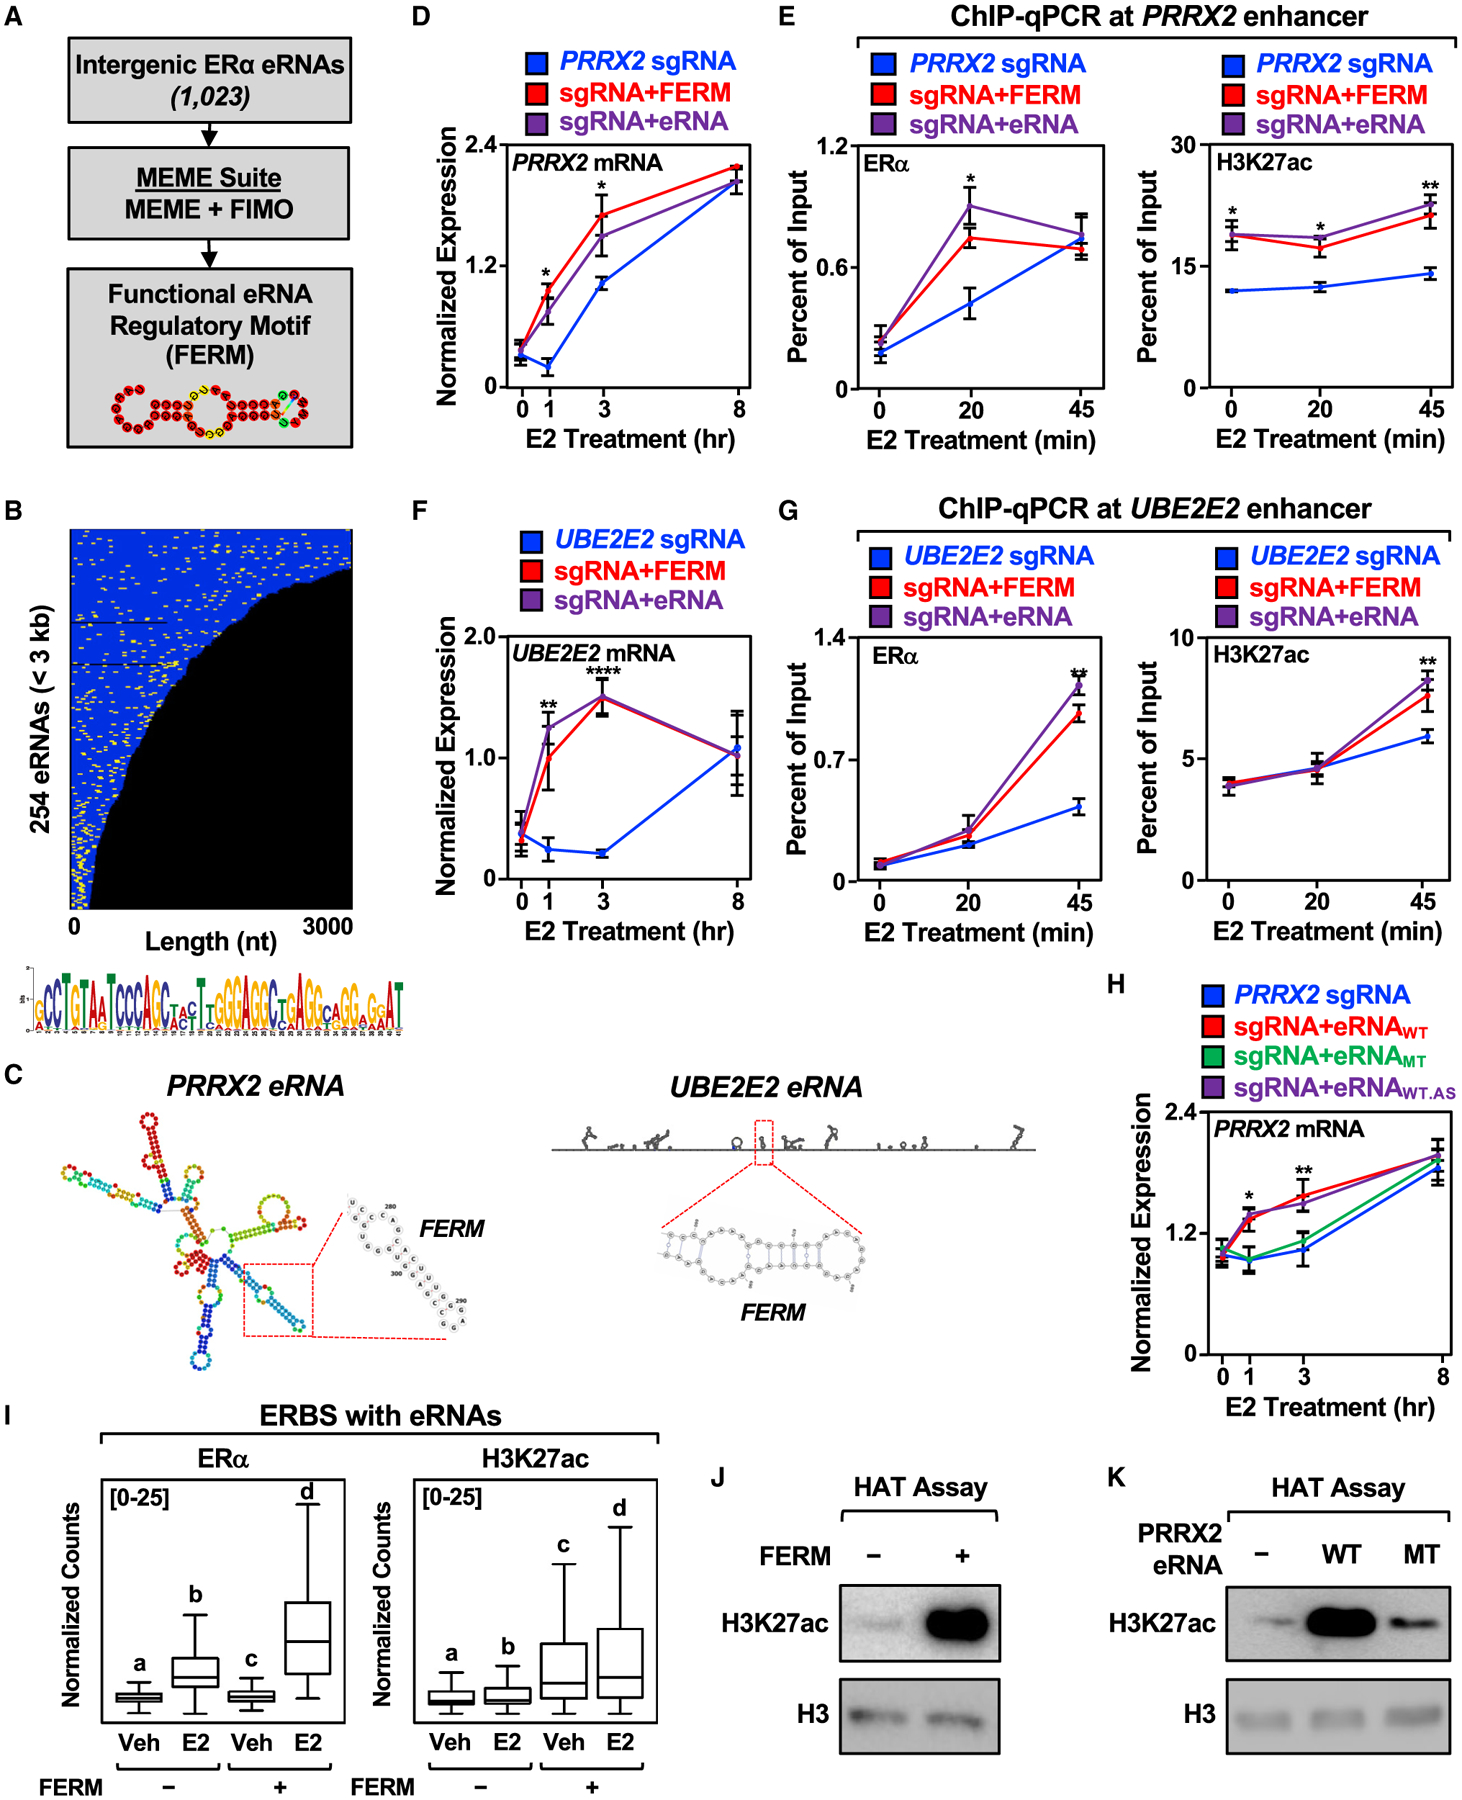
Figure 5. Identification of a FERM in E2-regulated eRNAs.

(A) Schematics of the pipeline for the discovery of FERM element within E2-regulated eRNAs using multiple em for motif elicitation (MEME) and find individual motif occurrences (FIMO) software.
(B) Graphical representation of the position of the FERM element (yellow) in the 254 E2-regulated eRNAs less than 3 kb that contain at least one FERM (273 eRNAs contain at least one FERM). Each eRNA is colored blue. The sequence for the FERM element is provided at the bottom.
(C) Predicted secondary structures of the PRRX2 eRNA (left) using RNAfold and the UBE2E2 eRNA (right) using Scanfold. The location of the FERM within the eRNA is marked with a red box.
(D) Targeting the FERM element to the PRRX2 enhancer is sufficient to modulate target gene expression. RT-qPCR analysis of PRRX2 mRNA expression levels normalized to GAPDH mRNA levels in dCas9-expressing MCF-7 cells with the PRRX2 sgRNA fused to the FERM element or the cognate PRRX2 eRNA. Each point represents the mean ± standard error of the mean (n = 4 biological/technical replicates). The asterisks indicate significant differences from the sgRNA control (two-way ANOVA, Fisher’s least significant difference post hoc test, *p < 0.05, **p < 0.01, ****p < 0.0001).
(E) ChIP-qPCR assays for ERα (left) and H3K27ac (right) at the PRRX2 enhancer with dCas9-expressing MCF-7 cells and various sgRNA/eRNA constructs. The cells were stimulated with E2 for the indicated time. Each point represents the mean ± standard error of the mean (n = 3 biological/technical replicates). The asterisks indicate significant differences from the corresponding control (two-way ANOVA, Fisher’s least significant difference post hoc test, *p < 0.05, **p < 0.01).
(F) Targeting the FERM element to the UBE2E2 enhancer is sufficient to modulate target gene expression. RT-qPCR analysis of the UBE2E2 mRNA expression level normalized to GAPDH mRNA levels in dCas9-expressing MCF-7 cells with UBE2E2 sgRNA fused to the FERM element or the cognate UBE2E2 eRNA. Each point represents the mean ± standard error of the mean (n = 4 biological/technical replicates). The asterisks indicate significant differences from the sgRNA control (two-way ANOVA, Fisher’s least significant difference post hoc test, *p < 0.05, **p < 0.01, ****p < 0.0001).
(G) ChIP-qPCR assays for ERα (left) and H3K27ac (right) at the UBE2E2 enhancer with dCas9-expressing MCF-7 cells and various sgRNA/eRNA constructs. The cells were stimulated with E2 for the indicated time. Each point represents the mean ± standard error of the mean (n = 3 biological/technical replicates). The asterisks indicate significant differences from the corresponding control (two-way ANOVA, Fisher’s least significant difference post hoc test, *p < 0.05, **p < 0.01).
(H) Mutation of the PRRX2 eRNA FERM abolishes the stimulatory effect of eRNA on target gene expression. RT-qPCR analysis of the PRRX2 mRNA expression level normalized to GAPDH mRNA levels in dCas9-expressing MCF-7 cells with PRRX2 sgRNA fused to wild-type, mutant, or antisense wild-type PRRX2 eRNA. The cells were stimulated with E2 for the indicated time. Each point represents the mean ± standard error of the mean (n = 3 biological/technical replicates). The asterisks indicate significant differences from the corresponding control (two-way ANOVA, Fisher’s least significant difference post hoc test, *p < 0.05, **p < 0.01).
(I) Boxplot analysis of ERα (left), and H3K27ac ChIP-seq (right) of ERBS containing eRNAs with or without FERM (±4 kb). Reads were normalized to the read depth of the libraries used. The boxes represent the 25th–75th percentile (band at median), with whiskers at 1.5 × interquartile range. Bars marked with different letters are significantly different—n(without FERM) = 940, n(with FERM) = 339 (one-way ANOVA, Fisher’s least significant difference post hoc test, p < 0.05).
(J and K) In vitro histone acetyltransferase (HAT) assay using recombinant histone H3.1/H4 tetramer, purified p300, and (J) chemically synthesized FERM or (K) in vitro transcribed wild-type or mutant PRRX2 eRNA. The level of H3K27ac normalized to H3 was detected by Western blot. Each experiment was performed three independent times.
See also Figure S5.
