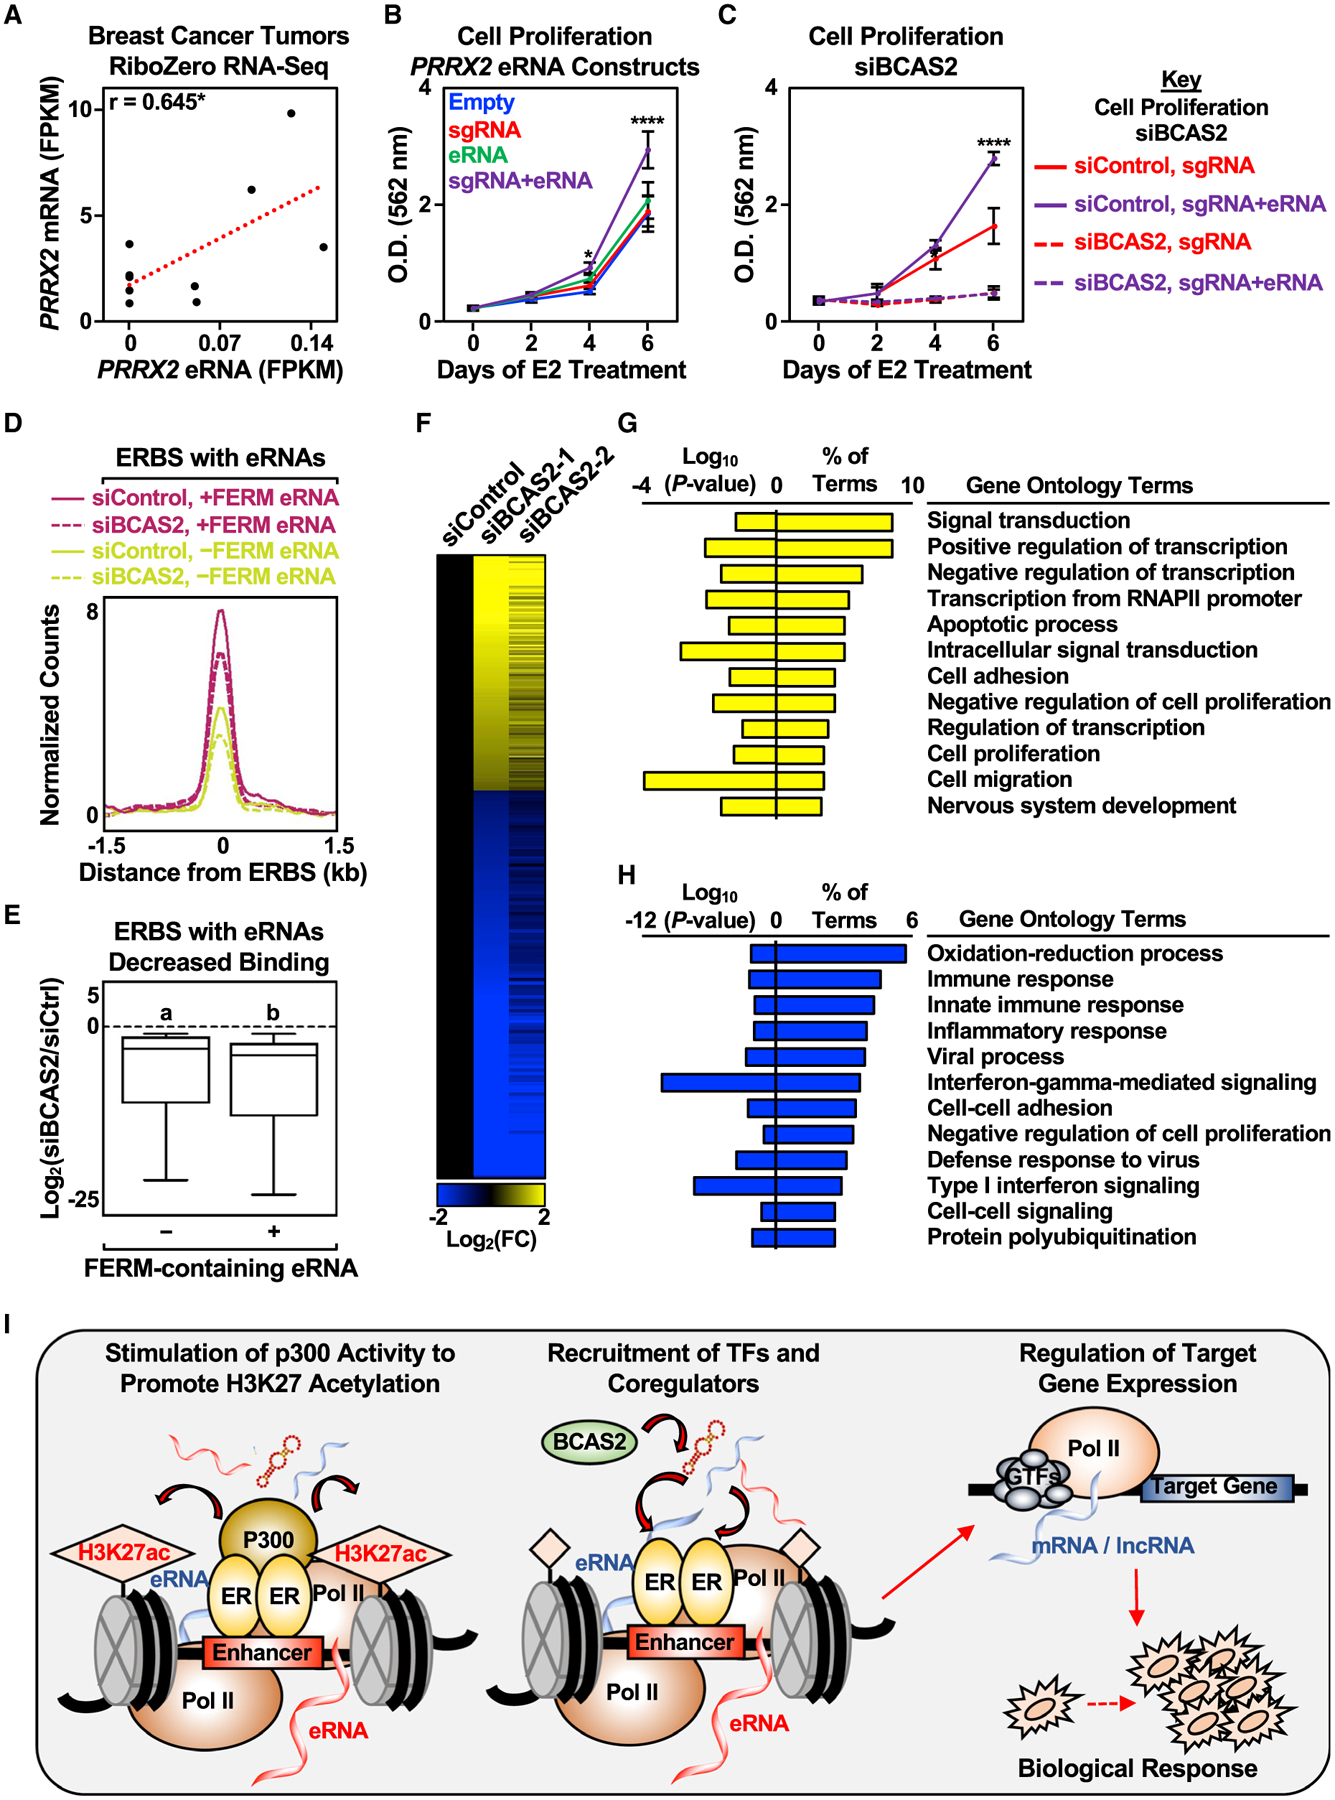
Figure 7. Biological responses of eRNAs in clinical samples and cell growth.

(A) Pearson’s correlation between PRRX2 mRNA and eRNA levels in nine breast cancer tumors was determined (two-tailed p value, *p < 0.05).
(B) Stimulatory effect of targeted PRRX2 eRNA on cell proliferation. Cell proliferation assay of dCas9-expressing MCF-7 cells with various PRRX2 sgRNA constructs. See (C) for a description of the statistics. Each point represents the mean ± standard error of the mean (n = 3 biological/technical replicates). The asterisks indicate significant differences from the corresponding empty control (two-way ANOVA, Fisher’s least significant difference post hoc test, *p < 0.05, ****p < 0.0001).
(C) Depletion of BCAS2 abolishes the stimulatory effect of targeted PRRX2 eRNA on cell proliferation. Cell proliferation assay of dCas9-expressing MCF-7 cells with PRRX2 sgRNA constructs upon control or BCAS2 knockdown. Each point represents the mean ± standard error of the mean (n = 3 biological/technical replicates). The asterisks indicate significant differences from the corresponding control (siControl, sgRNA at the specific time point) (two-way ANOVA, Fisher’s least significant difference post hoc test, *p < 0.05, ****p < 0.0001).
(D) Metagene representations from ERα ChIP-seq upon BCAS2 depletion between ERα binding sites (ERBS) containing eRNAs with or without FERM. The metagene plots represent the average read counts normalized to their respective input controls around the ERBS (±1.5 kb) in each group—n(without FERM) = 940, n(with FERM) = 339. The genomic assays were performed as two biological and two technical replicates.
(E) Boxplots of depleted ERα peaks upon BCAS2 depletion at ERα binding sites (ERBS) containing eRNAs with or without FERM (±1.5 kb). A cut-off of 2-fold decrease between siBCAS2/siCtrl at 45 min and at 0 min was used to define depleted ERα peaks. The boxes represent the 25th–75th percentile (band at median), with whiskers at 1.5 × interquartile range. Bars marked with different letters are significantly different—n(without FERM) = 207, n(with FERM) = 70 (two-tailed Mann-Whitney test, p = 0.0164). The genomic assays were performed as two biological and two technical replicates.
(F) Depletion of BCAS2 alters E2-regulated genes in MCF-7 cells. Heatmap of RNA-seq data representing changes in the expression of E2-regulated genes from MCF-7 cells treated with control or BCAS2 knockdowns for 48 h before E2 stimulation for 6 h. In total, 1,075 genes were differentially expressed between control and BCAS2 knockdown upon 6 h E2 treatment—n(upregulated) = 403, n(downregulated) = 672. The genomic assays were performed as two biological and two technical replicates.
(G and H) GO analysis of (G) upregulated and (H) downregulated genes upon BCAS2 knockdown in MCF-7 cells treated with E2 for 6 h.
(I) A model for estrogen-regulated eRNAs in enhancer assembly and gene expression. Details are provided in the text.
See also Figure S7.
