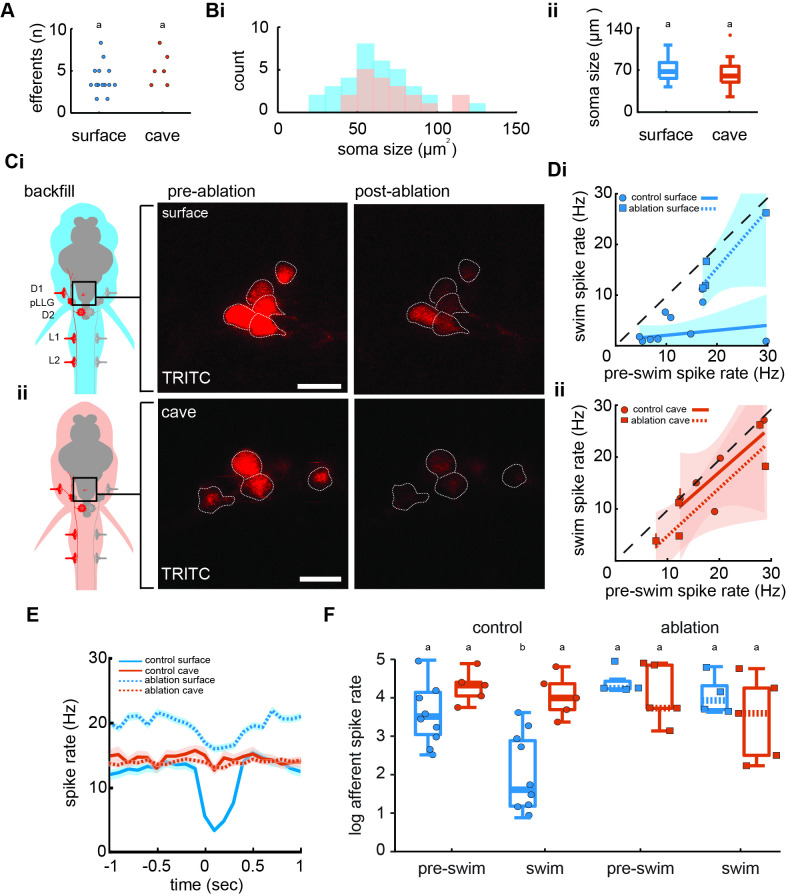
Figure 4. Efferent neurons are necessary for inhibition observed in afferents during swimming in surface fish but not cavefish.
(A) Backfilled hindbrain cholinergic efferent neurons were present in comparable numbers (2–3 cells) in both surface fish (n = 14) and cavefish (n = 6, unpaired two-way t-test: p = 0.2). (Bi) Efferent soma size in surface (blue) and cavefish (red) is similar in both populations (unpaired two-way t-test: p = 0.1, ii). (C) Efferent cell bodies were identified by backfilling rhodamine through posterior lateral line neuromasts in both surface fish (i) and cavefish (ii) and were ablated with a 30-s UV pulse. Scale bar: 20 µm. (D) The line of best fit of spike rates before compared to during the swim significantly excludes unity in nonablated, control surface fish (CI: -0.2 to 0.4, circle), but not in ablated surface fish (CI: -0.1 to 2.4, square), implying spike rate suppression in the former but not the latter (i). The slope of the line for control fish suggests the inhibition is not correlated to the spontaneous afferent activity preceding the swim (p = 0.2). The line of best fit of Pachón cavefish pre-swim and swim spike rates did not exclude unity in both control (CI: -0.5 to 2.2, circle) and ablated (CI: 0.9 to 1.8, square) treatments (ii). Dashed line indicates the line of unity, corresponding to no average difference of spike rate during swimming. (E) Instantaneous spike rates of Pachón cavefish were unaffected by ablating the lateral line whereas the inhibitory effect was eliminated in ablated surface fish. Time is relative to the onset of motor activity. (F) Surface fish (blue) display reduced spike rates during swimming compared to before swimming in control fish (Tukey’s post-hoc test: p < 0.01). Pachón cavefish (red) did not display reduced spike rate during swimming in neither control nor ablated treatments. Ablated surface individuals also did not display reduced spike rate during swimming resulting in a signaling phenotype comparable to cavefish. Groupings of statistical similarity are denoted by ‘a’ and ‘b’, whereas a is significantly different from b. All error bars represent ± standard error (SE).

