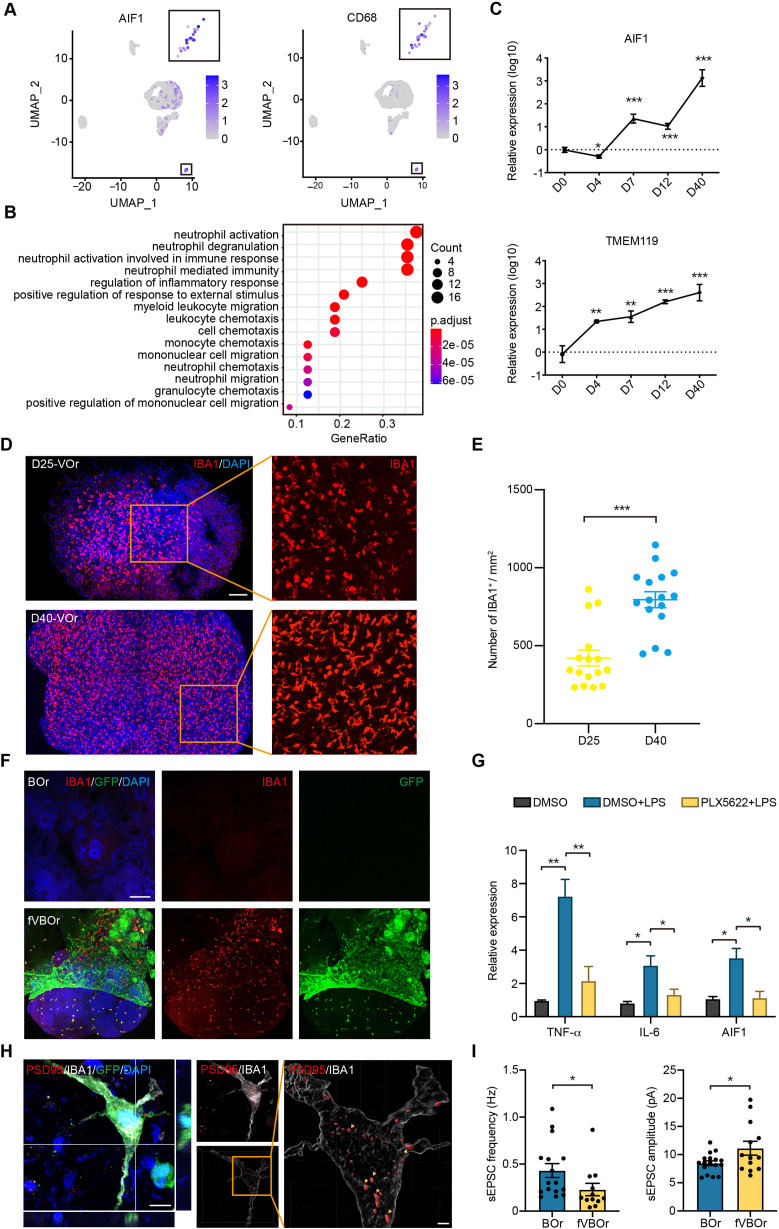
Figure 5. Microglial cells in fused vasculature and brain organoids (fVBOrs).
(A) UMAP plot showing single-cell expression pattern of microglial-specific markers in vessel organoids (VOr). Relative expression level is plotted from gray to blue colors. (B) Gene Ontology (GO) analysis of microglial cell marker genes (p-value<0.1 and false discovery rate [FDR] < 0.05). (C) qPCR analysis for expression of microglial markers AIF1 and TMEM119 in developing VOrs. Data are presented as mean ± SEM (n = 3 independent experiments with 6–7 organoids in each group at indicated time point). Error bars indicate SEM. **p<0.01, ***p<0.001. (D) Immunostaining of IBA1 for labeling microglial cells in day (D) 25 and D40 VOrs. Scale bar, 200 μm. (E) Quantification of the IBA1+ cell number in D25 and D40 VOrs. n = 16. Error bars indicate SEM. Student’s t-test, ***p<0.001. (F) Immunostaining of IBA1 for labeling microglial cells in BOrs and fVBOrs, respectively. Scale bar, 200 μm. (G) qPCR analysis for the expression of indicated genes in D40 fVBOrs treated with lipopolysaccharide (LPS) (500 ng/ml, MCE, HY-D1056) without or with PLX5622 2 μM (MCE, HY-11415) using DMSO as vehicle control. Relative expression was normalized to GAPDH. n = 3 independent experiments with 8–10 organoids in each group. Error bars indicate SEM. One-way ANOVA, *p<0.05, **p<0.01. (H) Double immunostaining and orthogonal view of IBA1 and PSD95 signals within microglia (MG)-like cells (left) and 3D-surface-reconstructed image (right). Arrows indicate synapse puncta engulfed in MG-like cells. Scale bar, 10 μm (left); 2 μm (right). (I) Quantification of the spontaneous excitatory post-synaptic current (sEPSC) frequency (left) and amplitude (right) in neurons of D70 BOrs and fVBOrs. Data are presented as mean ± SEM (BOrs: n = 16 neurons from six organoids; fVBOrs: n = 13 neurons from six organoids). Error bars indicate SEM. Two-tailed Student’s t-test. *p<0.05.


