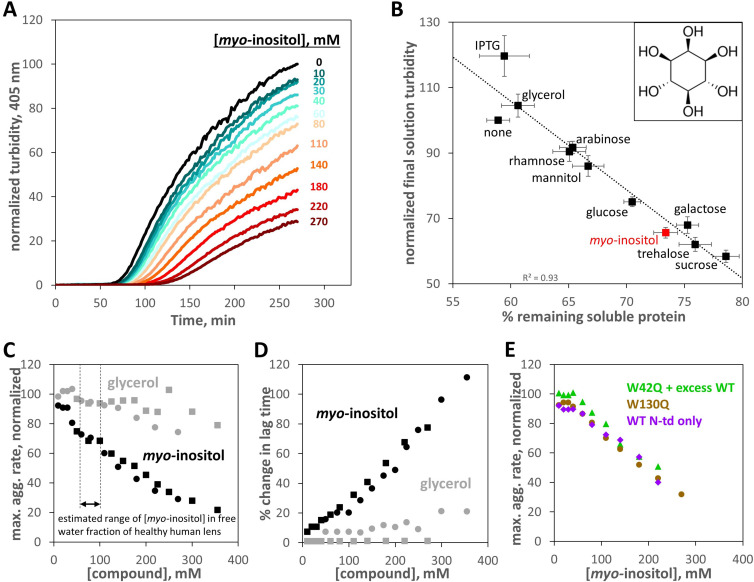
Figure 1. Suppression of human γD-crystallin aggregation by myo-inositol.
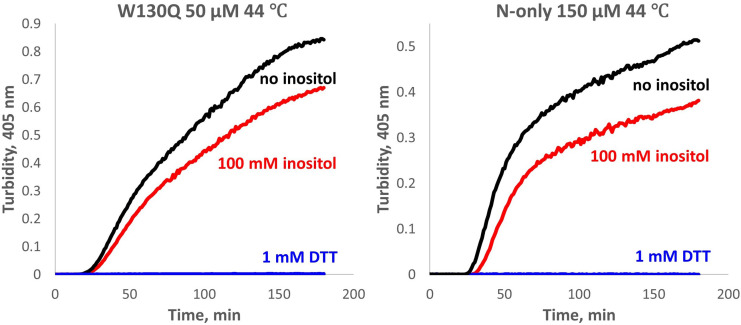
Oxidative aggregation of the cataract-mimicking W42Q variant of HγD was initiated as previously described (Serebryany et al., 2018). (A) Normalized turbidity traces for the oxidative aggregation of 40 μM HγD W42Q with varying concentrations of myo-inositol. (B) Sugars and sugar alcohols, each at 100 mM, suppressed HγD W42Q aggregation to varying degrees. Isopropyl-β-D-thiogalactoside (IPTG) moderately enhanced turbidity development. Myo-inositol (structure shown in inset) consistently and strongly suppressed turbidity development, second only to the disaccharides, trehalose and sucrose. A total of 8 independent replicates, at pH 7.4 (HEPES), pH 6.7 (PIPES), or pH 6.0 (MES) and 150 mM NaCl all produced similar results and were averaged together. Notably, the strong linear correlation between reduction in solution turbidity and increase in the proportion of protein remaining soluble indicated these compounds (except perhaps IPTG) did not significantly change aggregate geometry. Raw data are available as Figure 1—source data 1. (C) Dose response for aggregation suppression by myo-inositol compared to glycerol. Notably, myo-inositol had a significant effect in the physiological concentration range. Data from two independent replicates (circles, squares) are shown; black circles correspond to the data in panel A. All aggregation rates were normalized to the rate without myo-inositol. (D) Percent change in aggregation lag time for the same experiments as in Panel C. (E) Suppression of oxidative aggregation by myo-inositol generalizes to other HγD constructs: Green triangles, 20 μM W42Q whose aggregation is catalyzed by 180 μM WT HγD at 37 °C; Beige circles, 40 μM W130Q at 42 °C; Purple diamonds, 50 μM wild-type isolated N-terminal domain of HγD at 44 °C. All experiments were carried out in 10 mM PIPES pH 6.7, 150 mM NaCl, 1 mM EDTA, with 0.5 mM GSSG as the oxidant. Raw data and fitting for panels C,D,E are available as Figure 1—source data 2.

