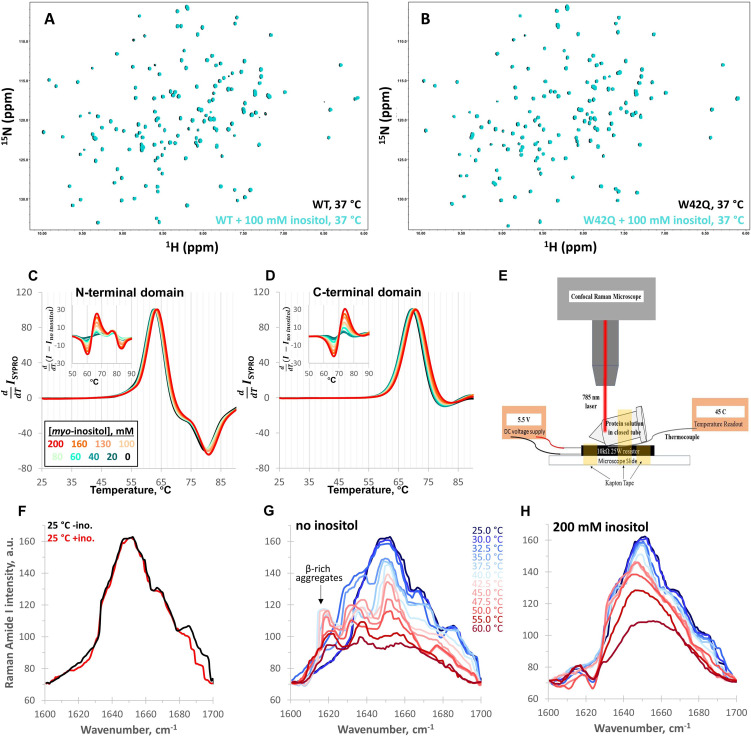
Figure 2. Myo-inositol has no effect on the native structure and only minor effects on stability.
(A, B) 1H-15N HSQC NMR spectra of full-length WT and W42Q HγD at 37 °C showed no evidence of interaction between myo-inositol and the protein’s native structure. (C, D) Differential scanning fluorometry with SYPRO Orange as the hydrophobicity probe revealed no change within the temperature range of aggregation but very small dose-dependent shifts toward higher melting temperatures. Normalized first derivative curves of SYPRO Orange fluorescence intensity are shown for both the N- and C-terminal domains, where peak positions correspond to Tm; insets show the difference curves. (E) Schematic of the design of the thermal scanning Raman spectroscopy apparatus. (F) Raman Amide I band spectra of the isolated N-terminal domain were likewise overlapping at low temperatures. (G, H) At 32.5 °C and 35.0 °C without inositol, a β-sheet peak ~1630 cm–1 became prominent, while a ~1620 cm–1 peak, typical of β-sheet-rich aggregates, was observed above 35.0 °C. Both features were strongly suppressed by 200 mM inositol.


