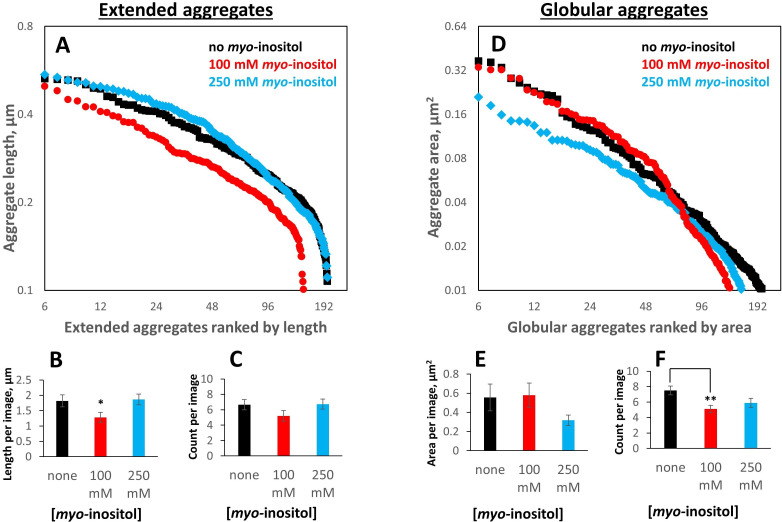
Figure 4. Myo-inositol produces only modest shifts in the aggregate particle size distribution.
Aggregates generated as in Figure 1 in the presence of 0, intermediate (100 mM) or high (250 mM) myo-inositol were imaged and analyzed by negative-stain transmission electron microscopy (Figure 3) in a double-blinded procedure, with a total of 103 separate images used for analysis (30, 29, and 30 for 0, 100, and 250 mM inositol, respectively, plus 14 control images). Aggregates were classified by inspection into extended (irregular fibrils) vs. globular (collapsed/coalesced) based on whether a curve could be unambiguously traced from end to end. (A, B, C) 100 mM myo-inositol decreased both the number and the length of extended aggregates, but 250 mM myo-inositol did not. Error bars represent S.E.M. of particle counts and their combined lengths per image. Two-sample T-test p=0.04 and 0.02 between 0 and 100 mM and 100 and 250 mM, respectively, in (B) and 0.13 and 0.11, respectively, in (C). (D, E, F) 100 mM myo-inositol depleted the smallest globular aggregates, slightly increased the size of intermediate ones, and left the largest ones unchanged, but 250 mM myo-inositol reduced the size of the largest aggregates. Two-sample T-test p=0.12 and 0.07 between 0 and 250 mM and 100 and 250 mM, respectively, in (E), and p=0.003 between 0 and 100 mM in (F).

