. 2022 Jun 20;11:e76923. doi: 10.7554/eLife.76923

Figure 6. Myo-inositol targets the rate-limiting bimolecular interaction and indirectly favors reduction of disulfide-locked misfolded aggregation precursors.

(A) Aggregation of the W42Q/C108S/C110S triple-mutant (lacking the redox-active site in the C-terminal domain) was almost completely suppressed by 200 mM myo-inositol. Here ([GSH]+2[GSSG]) was only 0.5 mM to facilitate subsequent reaction of the protein with PEG-maleimide; as such, the redox buffers are designated OxD’ to distinguish them from those in Figure 5. (B) PEGylation gel-shift assays of the end-points of aggregation reactions in panel A reveal the redox state distributions of the protein, where four free thiols per molecule indicate it is fully reduced; two free thiols indicate one internal disulfide; and 0 free thiols, two internal disulfides. Markers were generated by limited PEGylation of the WT protein, which contains six thiols. The differential effect of inositol was maximal at OxD’ 0.15 and 0.2; results for higher and lower OxD’ values are shown in the figure supplement. (C) Two alternative graphical models explaining how myo-inositol, despite being redox-inert, can alter the redox state distribution indirectly in redox-buffered solutions. Models 1 and 2 are not mutually exclusive and differ from each other by the order of misfolding and oxidation: high and low OxD is expected to favor Model 1 and Model 2, respectively. When disulfide bonding is reversible, inositol may favor reduction and refolding by suppressing the transition from misfolded monomer to transient dimer. (D) Concentration dependence of W42Q aggregation at OxD 0.2 with and without 100 mM myo-inositol. The rightward shift in the curve with inositol (smaller pre-exponential factor) suggests that inositol makes it less likely that a bimolecular interaction will be productive for aggregation, while the larger exponent in the power law further indicates that in the presence of inositol assembly beyond the dimer makes a greater relative contribution to aggregation. Raw data and fitting are available as Figure 6—source data 1.

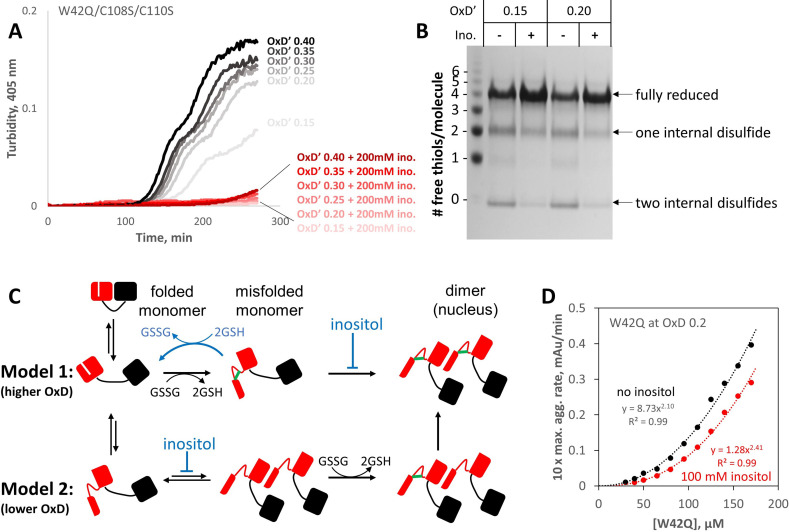
Figure 6—source data 1. Raw numerical data and fittings for solution turbidity experiments in Figure 6D.
elife-76923-fig6-data1.xlsx (506.1KB, xlsx)

Figure 6.

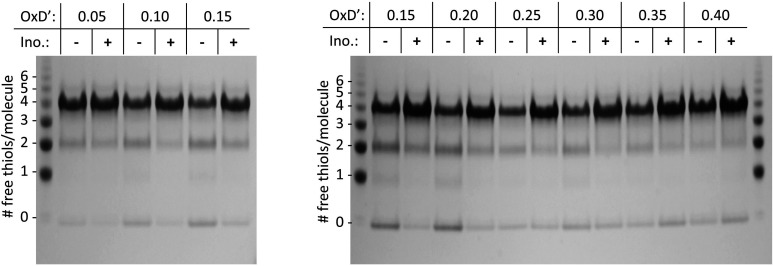
Figure 6—figure supplement 1. PEGylation gel shift assays reveal shifts in the redox distribution of the W42Q/C108S/C110S protein induced by 200 mM myo-inositol.

Figure 6—figure supplement 1.

SDS-PAGE gels from two separate experiments are shown, at the OxD’ values indicated. The differences are greatest in the intermediate OxD’ range (0.10–0.30). The left marker lane and first four sample lanes are what is shown in Figure 6B. At OxD’ 0.05, too little aggregation took place for the differences to become clear. Beyond OxD’ 0.3, the singly and doubly disulfide-bonded precursors were lost from the inositol-free samples, and the two distributions showed hints of a reversal. The likely explanation is that at high OxD’ without inositol, precursors have already aggregated and precipitated by the end-point of the assay at the higher OxD’ values, while in the presence of inositol a fraction of doubly-disulfide bonded aggregates is still soluble, along with the fraction that remains fully reduced. It is also worth noting that precipitation of the aggregated protein leads to removal of disulfide bonds from the solution, so the true final OxD’ value is lower in the absence of inositol when protein aggregation is sufficiently extensive to lower soluble [GSSG]. Full unedited gels are available in the Figure 6—figure supplement 1—source data 1 folder.
Figure 6—figure supplement 1—source data 1. Full unedited images of gels in Figure 6—figure supplement 1.
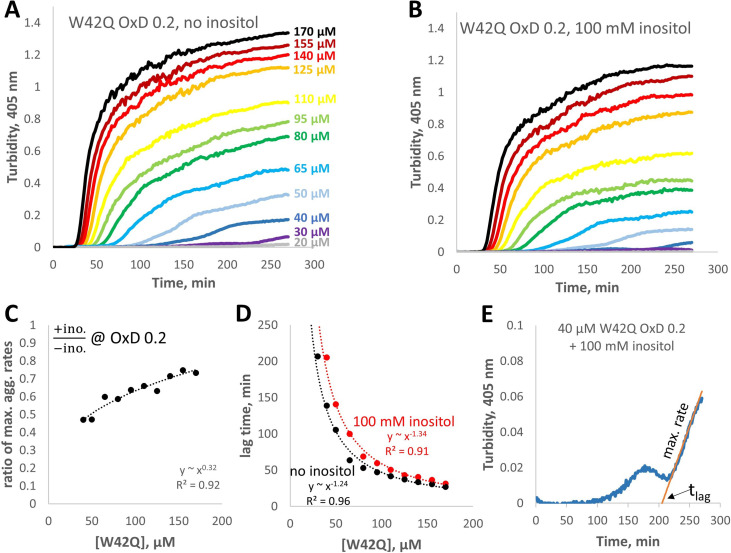
Figure 6—figure supplement 2. Concentration-dependence of W42Q aggregation curves with and without myo-inositol.

Figure 6—figure supplement 2.

(A,B) The full solution turbidity traces, from which maximum rates were extracted for Figure 6D. (C) Ratios of the maximum aggregation rate show dependence on concentration; in other words, inositol was most effective at suppressing aggregation at lower [W42Q], as should be expected from a suppressor of aggregate formation rather than coalescence. (D) Lag times for the curves in panels A and B. (E) An illustration of the empirical fitting procedure for extracting the maximum rates and lag times from the solution turbidity curves, on the example of the second-lowest curve in panel B. Note that when the aggregation curves were biphasic the fits were applied only to phase 2, when turbidity rose the most rapidly. This fitting procedure was also the main reason for the large increase in apparent lag times in Figure 5C.