. 2022 Jun 20;11:e76923. doi: 10.7554/eLife.76923

Figure 7. Myo-inositol inhibits aggregation even at later stages.

When added late in the aggregation process, myo-inositol slowed down the rate of subsequent aggregation in a dose-dependent manner. Triplicate W42Q samples were allowed to aggregate initially in 60 μl volume, then 40 μl of myo-inositol solutions or blank buffer was added and the incubation resumed. Light scattering did not change greatly on dilution due to the vertical optics of the plate reader. The discontinuity in the curves shows the dead time of myo-inositol addition and mixing. The curves shown are averages of four technical replicates at each of two different [W42Q] (upper curve, 75 μM; lower curve, 50 μM) in OxD 0.2 buffer, with error bars showing S.E.M. for each turbidity reading (every 90 s).

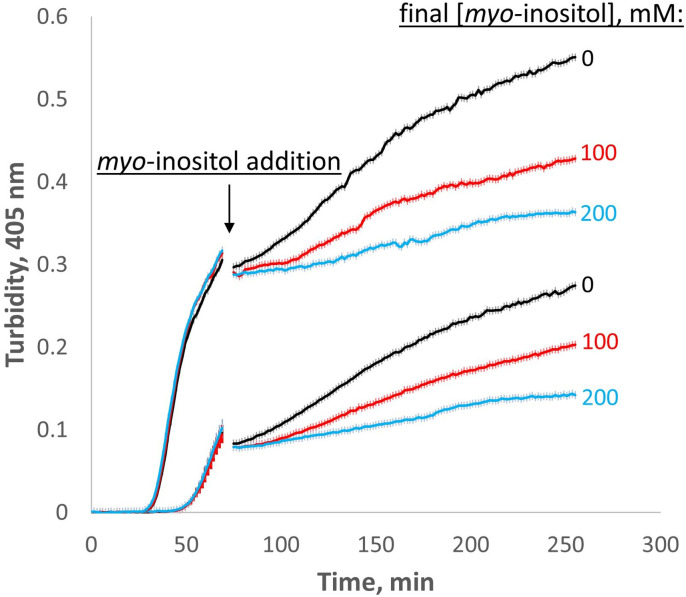
Figure 7.

Figure 7—figure supplement 1. Myo-inositol extends the first (slow) phase of aggregation when added early in the aggregation process.

Figure 7—figure supplement 1.

HγD W42Q samples at the indicated concentrations were allowed to begin aggregating in 75 μl volume, followed by addition of 25 μl buffer or inositol to the final concentration of 100 mM along with sufficient W42Q to maintain total [W42Q] at the indicated value. The discontinuities in the curves are the times of inositol addition and mixing. Four technical replicates were carried out in parallel for each set of curves, and the curves shown consist of averages ± S.E.M. of the replicates. Inset is a zoom-in of part of the plot for 30 μM W42Q showing the error bars for turbidity readings.