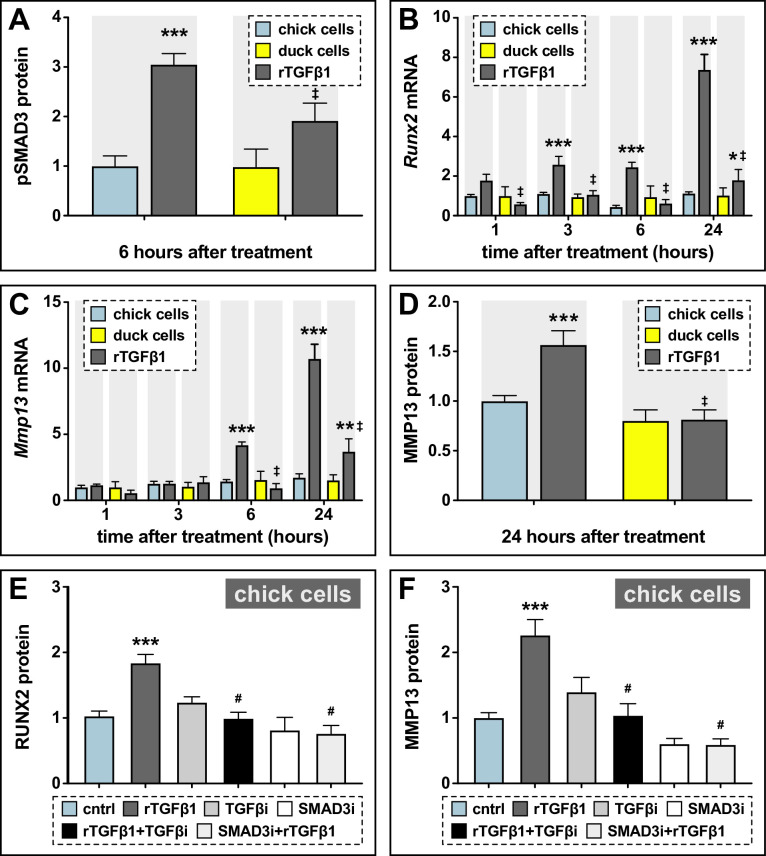
Figure 3. Sensitivity of chick and duck cells to rTGFβ1 and effects of TGFβR1 and SMAD3 inhibition on RUNX2 and MMP13.
(A) pSMAD3 protein levels in cells treated for 2 hr with 5 ng/ml rTGFβ1 (dark gray) in chick (blue) and duck (yellow) cells show a significant induction in chick (n=8). (B) Chick and duck cells treated with rTGFβ1 for 1–24 hr. Chick Runx2 mRNA increases with rTGFβ1 treatment at 3 and 6 hr and at 24 hr, while duck Runx2 does not increase until 24 hr. In rTGFβ1 treated cells, duck have significantly lower Runx2 at every time point compared to chick (n=8). (C) Chick Mmp13 mRNA increases with rTGFβ1 treatment at 6 hr and at 24 hr, while duck Runx2 does not increase until 24 hr. In rTGFβ1 treated cells, duck have lower Mmp13 at every time point compared to chick (n=8). (D) MMP13 protein in cells treated for 24 hr with rTGFβ1 shows an induction in chick but no response in duck (n=8). (E) RUNX2 protein levels in chick cells treated for 24 hr with rTGFβ1 (dark gray), TGFβR1 inhibitor (medium gray), a combination of both rTGFβ1 and TGFβR1 inhibitor (black), SMAD3 inhibitor (white), and a combination of both rTGFβ1 and SMAD3 inhibitor (light gray). RUNX2 protein increases with rTGFβ1, but when rTGFβ1 is combined with either a TGFβr1 or a SMAD3 inhibitor, there is a significant decrease compared to rTGFβ1 alone (n=12). (F) MMP13 protein increases with rTGFβ1 treatment, but when rTGFβ1 is combined with either a TGFβR1 or a SMAD3 inhibitor, there is a significant decrease compared to rTGFβ1 alone (n=12). * denotes significance from control p≤0.05, ** denotes significance from control p≤0.01, *** denotes significance from control p≤0.001, # denotes significance from rTGFβ1, † denotes significance between chick and quail, and ‡ denotes significance between chick and duck.


