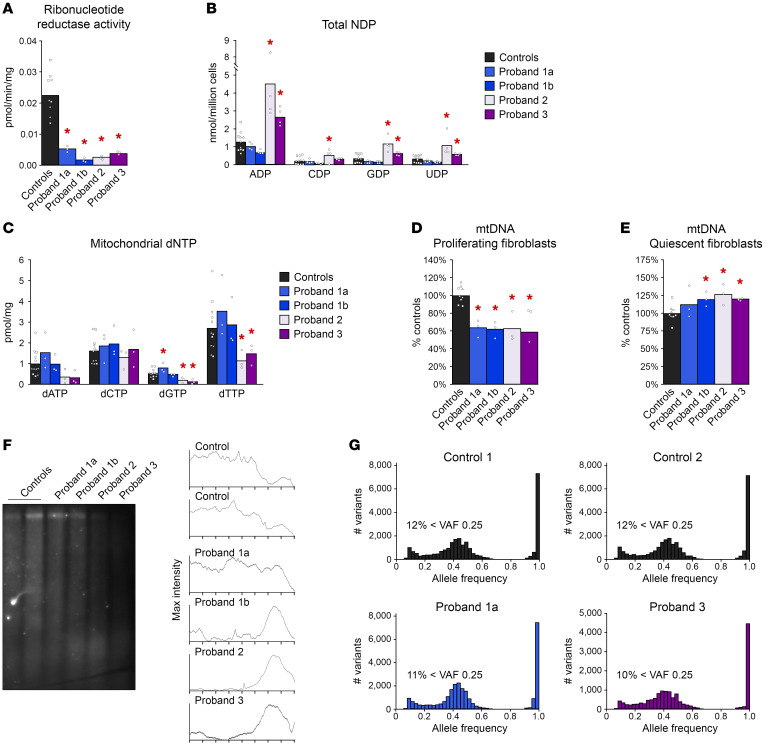
Figure 3. Functional characterization of RRM1 variants in primary fibroblasts.
(A) RNR activity of proband fibroblasts and 3 controls. Each control individual is represented by a distinct symbol. Identical symbols around each bar represent technical replicates. (B) Total NDPs from proliferating proband fibroblasts and 3 controls. (C) Mitochondrial dNTP pools of proliferating proband fibroblasts and 4 controls. (D) Proliferating fibroblast mtDNA quantitation. (E) Quiescent fibroblast mtDNA quantitation. (F) Southern blot indicating mtDNA ribonucleotide content. Maximum intensity plots illustrate the fragment size distribution of each lane. Representative of 3 experiments. (G) Variant allele frequency (VAF) histograms from WES data of proband 1a, proband 3, and 2 siblings of proband 1a as controls. We used 2-way ANOVA with the one individual per cell method to compare the mean outcome of each proband to the controls. Findings were considered as statistically significant if the corresponding P values were less than 0.05. *P < 0.05.

