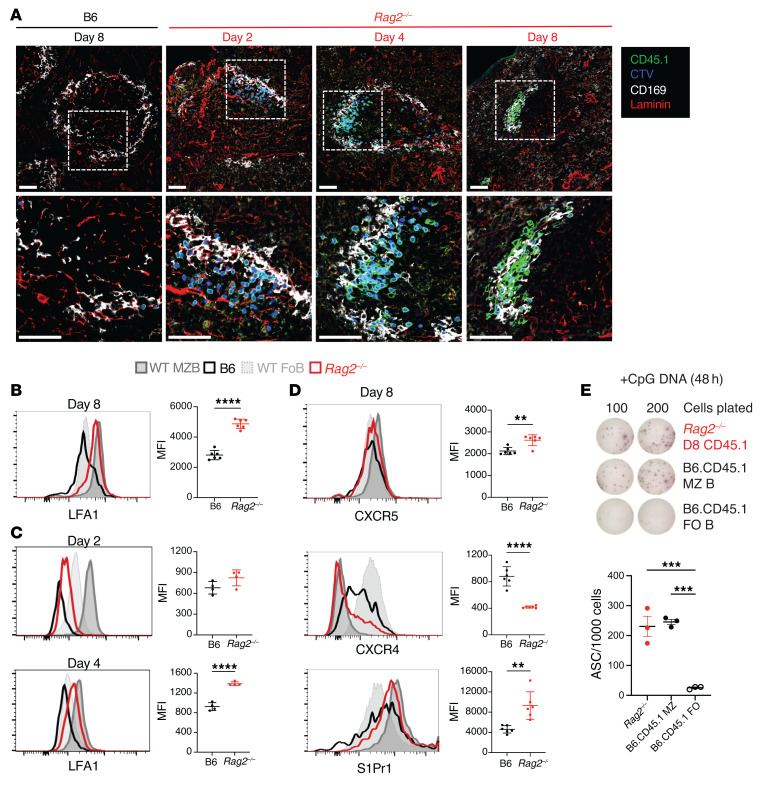
Figure 3. Follicular B cells transferred into lymphopenic hosts localize to marginal zone–like structures in splenic follicles and acquire integrin and chemoattractant receptor expression of marginal zone B cells.
Congenically marked CD45.1+ FoB cells were labeled with CTV and adoptively transferred into B6 or Rag2–/– hosts. Flow cytometry and immunofluorescence microscopy were then performed on recipient spleens. (A) Immunofluorescence microscopy of spleen sections of B6 and Rag2–/– recipients at the indicated time points after adoptive transfer, with labeled CD45.1+ cells (green), CTV (blue), CD169 (white), and laminin (red). Proliferating cells that dilute CTV appear lighter in color. Dotted regions are magnified in the second row of images. One representative sample out of 4 is shown. Scale bars:50 μm. (B–D) Histograms depict the expression of LFA-1, S1Pr1, CXCR5, and CXCR4 among resting donor FoB or MZB cells from B6-CD45.1 donor mice (light/dark gray) or CD45.1+ B cells recovered from B6 (black) and Rag2–/– (red) recipients on day 8 after transfer (B and D) and on days 2 and 4 (C). Graphs quantify the MFI of indicated surface markers among CD45.1+ B cells recovered from B6 or Rag2–/– recipients. Data are shown as the mean ± SEM. **P < 0.01 and ****P < 0.0001, by 2-tailed Student’s t test. (E) Donor-derived CD45.1+CD19+ B cells recovered from Rag2–/– recipients at day 8 after transfer and freshly sorted B6-CD45.1 MZB and FoB cells were stimulated in culture with CpG DNA for 2 days. Antibody secretion from live cells was assessed by ELISpot. Representative wells are displayed and the number of antibody-secreting cells (ASCs) per 1000 live cells in culture is shown (individual data points indicate the mean ± SEM). ***P < 0.001, by 1-way ANOVA, Tukey’s post test. (B–E) Each data point represents an individual mouse.

