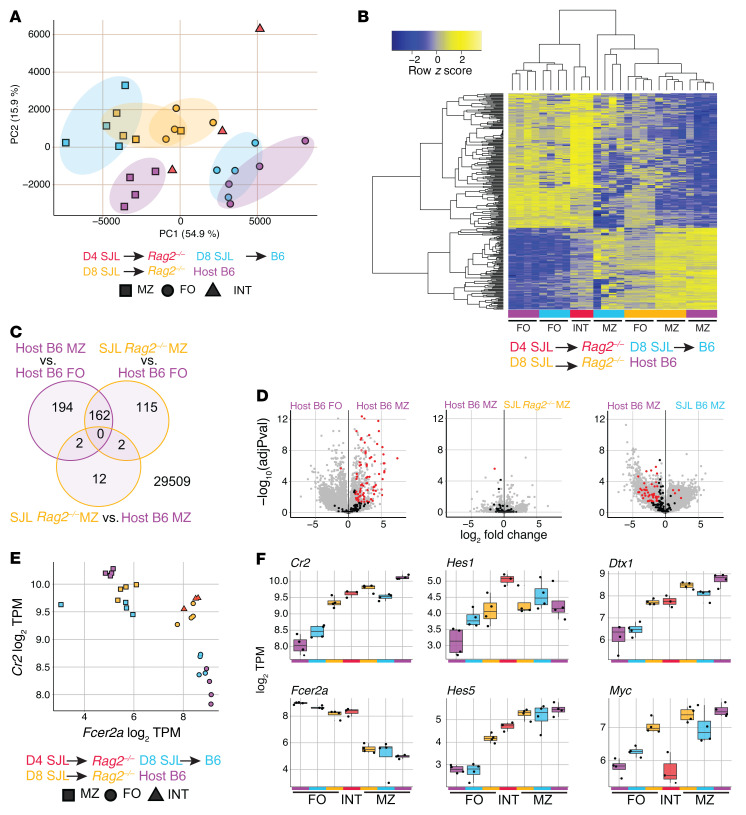
Figure 5. Follicular B cells adoptively transferred into a lymphopenic environment attain a full marginal zone B cell transcriptome and upregulate a broad Notch signature.
Congenically marked B6-CD45.1 FoB cells were labeled with CTV and i.v. transferred to either B6 or Rag2–/– hosts. RNA-Seq was then performed on B cells twice-sorted from animals euthanized after 4 and 8 days, sorting first on CD45.1/2 and second on follicular or marginal zone B cell gates (d8) or intermediate gates (d4) (see Supplemental Figure 2). (A) Principal component analysis of all samples with colors indicating transfer groups and times and shapes indicating cell-type sort gates. (B) Expression of a MZB/FoB signature — defined as genes differentially expressed between host B6 MZB and FoB cells (adjusted P value < 0.01, log2 fold change > 2) — is shown for all samples as the z score across each row. Samples in columns are hierarchically clustered by Spearman’s correlation. (C) Venn diagrams displaying differential gene testing results of the indicated comparisons. Shown are the number of genes differential (adjusted P value < 0.01, log2 fold change > 2) without respect to direction. (D) Volcano plots indicating the magnitude and significance of gene expression changes between indicated groups for all (gray), and highlighted (black/red) empirically defined MZB cell Notch2-regulated genes (genes significantly downregulated in MZB cells after 24 hours of anti-N2 antibody blockade) (28). Red indicates significance (adjusted P < 0.05; log2 fold change > 1). (B–D) Differential expression was calculated by empirical Bayes method with Benjamini-Hochberg correction with indicated cutoffs. (E and F) Log2 transcripts per million (TPM) are shown for indicated genes as 2-gene correlation (E) and selected individual genes (F). Adoptive transfer groups are shown by color, and sort gate is indicated by shape.

