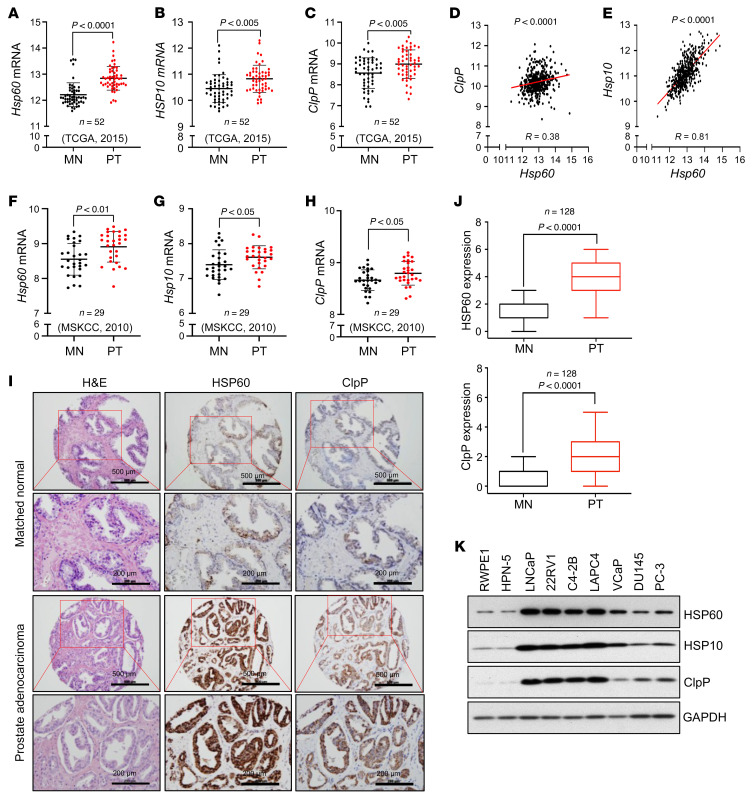
Figure 4. The UPRmt components are upregulated in human PCa.
(A) Hsp60 transcript reads in prostate tumors compared to matched normal counterparts from TCGA 2015 data set. (B) Hsp10 transcript reads in prostate tumors (PTs) compared to matched normal (MN) counterparts from TCGA 2015 data set. (C) ClpP transcript reads in PTs compared to MN counterparts from TCGA 2015 data set. (D) Correlative analysis between Hsp60 and ClpP transcript reads from TCGA 2015 data set. (E) Correlative analysis between Hsp60 and Hsp10 transcript reads from TCGA 2015 data set. (F) Hsp60 transcript reads in PTs compared to MN counterparts from the MSKCC 2010 data set. (G) Hsp10 transcript reads in PTs compared to MN counterparts from the MSKCC 2010 data set. (H) ClpP transcript reads in PTs compared to MN counterparts from the MSKCC 2010 data set. (I) Representative IHC images from PCa TMA stained with H&E and for HSP60 or ClpP. Scale bars: 500 μm (rows 1 and 3) and 200 μm (rows 2 and 4). (J) Anti-ClpP and -HSP60 IHC images were scored and quantified. (K) Protein expression of HSP60, HSP10, and ClpP in nonmalignant normal prostate cell lines (RWPE1 and HPN-5) and various PCa cell lines. GAPDH serves as a loading control. P values were calculated by 2-tailed Student’s t test (A–H and J).

