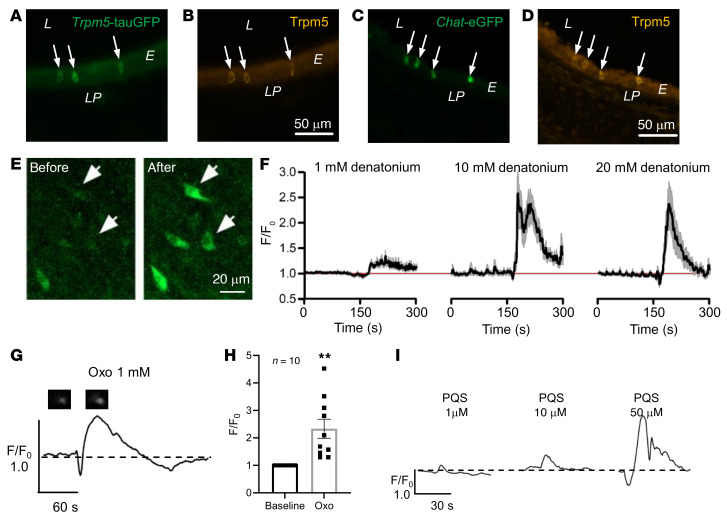
Figure 1. Measurements of intracellular calcium levels in Trpm5-GCaMP3 cells.
(A and B) Immunohistochemical staining of tracheal sections from a Trpm5-tauGFP (A and B) or Chat-eGFP (C and D) mouse using an antiserum against Trpm5. L, lumen; E, epithelium; LP, lamina propria. (E) Image of the trachea of a Trpm5-GCaMP3 mouse showing an increase in GCaMP3 fluorescence in individual Trpm5+ cells after denatonium application (20 mM). Scale bars: 50 μm (A–D) and 20 μm (E). (F) Graphs showing Ca2+ transients of Trpm5+ tracheal cells from Trpm5-GCaMP3 mice responding to 1, 10, or 20 mM denatonium applied at 180 seconds (left, central, and right graph, respectively). Data shown as mean ± SEM of the normalized (F/F0) GCaMP3 fluorescence intensities. Red line shows the initial (start recording, t = 0, F/F0 = 1) level of the normalized intensities. n cells = 23 from 3 mice. (G) Representative curve for the Ca2+ response of a Trpm5+ cell stimulated with 1 mM N-(3-oxododecanoyl)-L-homoserine lactone (Oxo). Images of the Trpm5+ cell show GCaMP3 baseline fluorescence and fluorescence after stimulation. (H) Oxo (1 mM) led to a significant transient increase in [Ca2+]i in Trpm5+ cells from Trpm5-GCaMP3 mouse tracheae. Data shown as single values and mean ± SEM of the normalized (F/F0) GCaMP3 fluorescence intensities (n cells = 10 from 3 mice). **P < 0.01 by 2-tailed, unpaired Student’s t test. (I) Representative curve for the Ca2+ response of Trpm5+ cells to 1, 10, or 50 μM Pseudomonas aeruginosa quinolone signal (PQS) (1 μM: n cells = 28 from 3 tracheal pieces; 10 μM: n cells = 30 from 3 tracheal pieces; 50 μM: n cells = 40 from 4 tracheal pieces).

