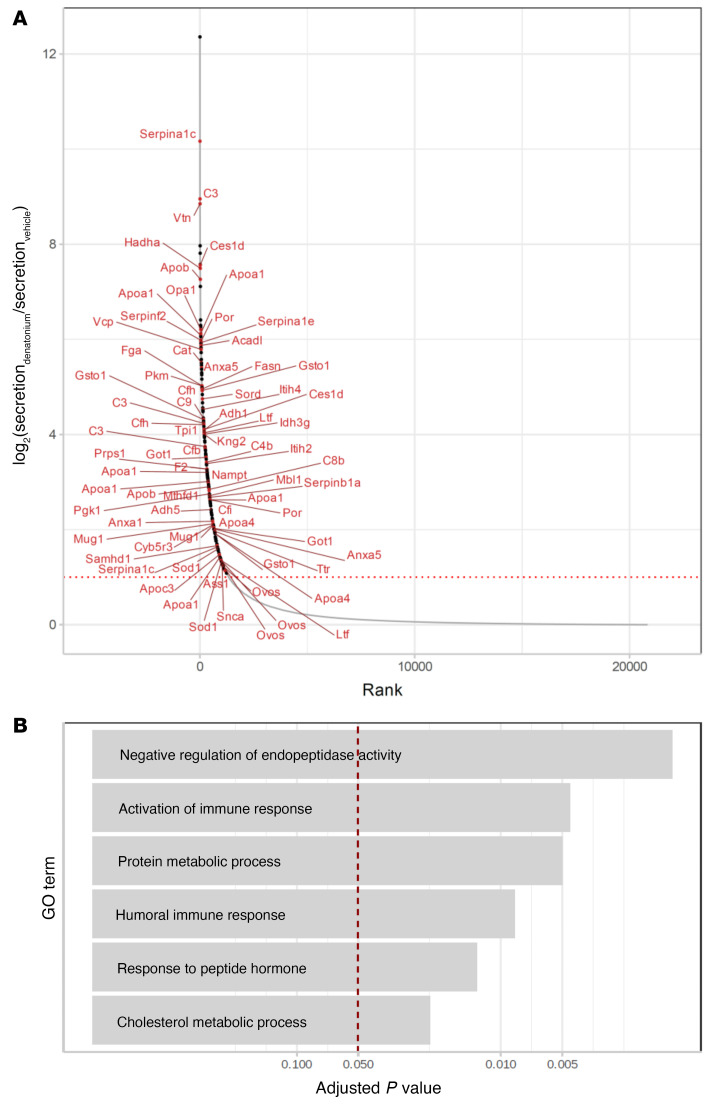
Figure 10. Secretome/proteome analysis of tracheae stimulated with denatonium.
(A) Log2(fold change) of peptide enrichment in the supernatants (relative to their concentration in the tracheal cells) after denatonium treatment (y axis) and the corresponding rank (x axis; derived from Bayesian linear model, unadjusted, n = 6). Large dots denote peptides with supernatant concentration after denatonium treatment significantly upregulated both absolutely (in comparison with their concentration in the supernatants of vehicle-treated cells) and relative to their cellular concentration (FDR-corrected P value ≤ 0.05, log2[fold change] ≥ 1 in both tests). Peptides belonging to the biological processes shown in B are drawn in red and labeled by the names of their genes. (B) Gene Ontology Biological Processes significantly enriched (FDR-corrected Fisher exact test P value ≤ 0.05) among the peptides upregulated by denatonium treatment.

