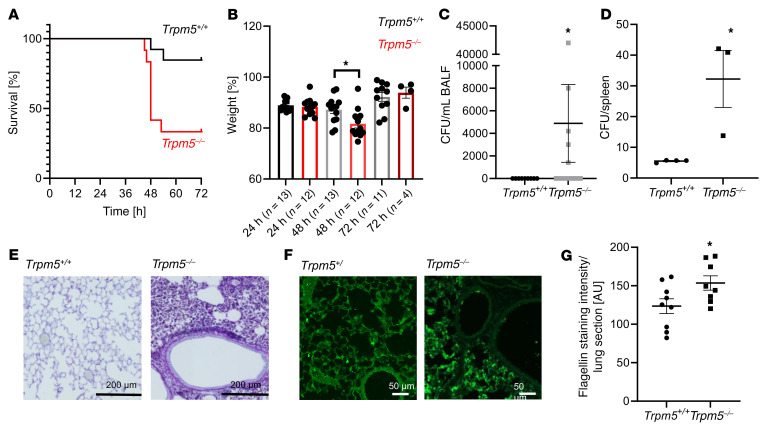
Figure 8. Infection of mice with the P. aeruginosa strain NH57388A.
(A) Survival rate of WT (Trpm5+/+) and Trpm5-deficient (Trpm5–/–) mice revealed decreased survival rates in Trpm5–/– mice after infection with P. aeruginosa NH57388A in the first 72 hours (n = 12–13 mice). (B) Trpm5–/– mice showed significantly greater weight loss 48 hours after infection with P. aeruginosa NH57388A compared with WT controls. Note that the weight is shown only for the mice that survived. (C) Seventy-two hours after infection, an increased bacterial load (CFU) was detected only in bronchoalveolar lavage fluid (BALF) samples of Trpm5–/– mice (n = 9–12 mice). (D) Trpm5–/– mice had an increased bacterial load (CFU/mouse) in the spleen 2 days after infection (n = 3–4 mice). (E) Representative images of gram staining of WT and Trpm5–/– lung sections 3 days after infection revealed more bacterial cells and destruction of alveoli in Trpm5–/– animals. (F) Lung sections of WT and Trpm5–/– mice stained for P. aeruginosa (green) 3 days after infection showed more flagellin staining, indicative of a higher number of bacteria and biofilm formation in Trpm5–/– animals. Scale bars: 200 μm (E) and 50 μm (F). (G) Quantification of results in F (n = 8–9 mice). In B–D and G, data are depicted as mean ± SEM. *P < 0.05 by 2-tailed, unpaired Student’s t test.

