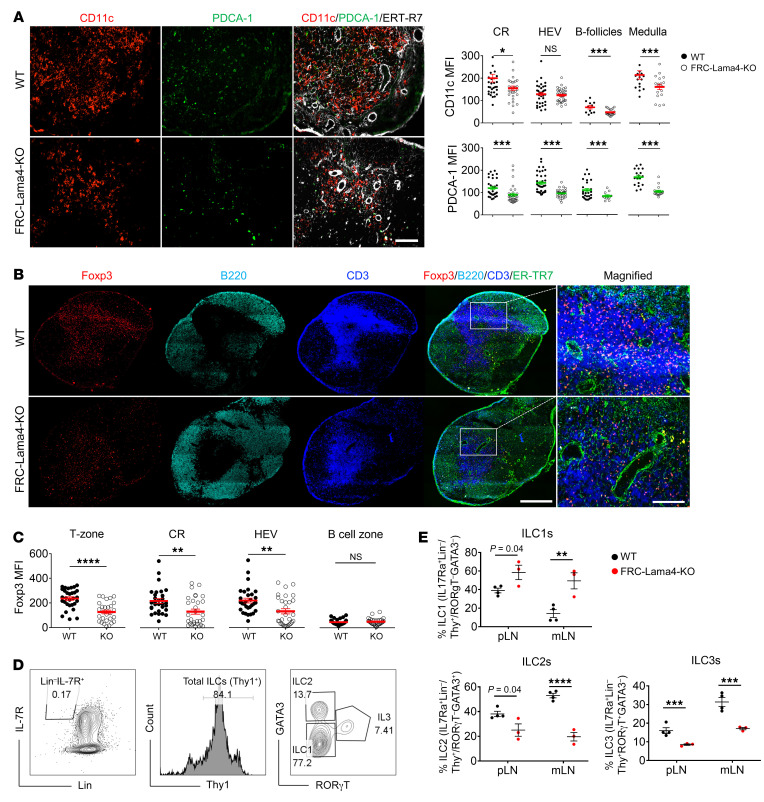
Figure 3. FRC-Lama4 depletion coincides with decreased DCs and Tregs and altered ILCs.
(A) Fluorescent images of FRC-Lama4–KO and WT LN cryosections stained for CD11c, PDCA1, and ER-TR7. Original magnification, ×20. Scale bar: 100 μm. Quantification of CD11c and PDCA-1 intensity in indicated LN regions. (B) Whole-mount scanning of LN cryosections from FRC-Lama4–KO and WT mice, stained for Foxp3, B220, CD3, and ER-TR7. Original magnification, ×20. Scale bars: 500 μm (left); 100 μm (right). (C) Quantification of Foxp3 intensity in indicated LN regions. (D and E) Gating strategy (D) (values show percentages) and quantification (E) of ILC subsets in LNs. Representative of 3 independent experiments. (A–E) Three independent experiments, 3 mice/group, 3 LNs/mouse, 3 sections/LN, and 3-5 fields/section. Student’s unpaired, 2-tailed t test for 2-group comparisons. Data are represented as mean ± SEM. *P < 0.05; **P < 0.01; ***P < 0.001; ****P < 0.0001. P < 0.05 was considered significant.

