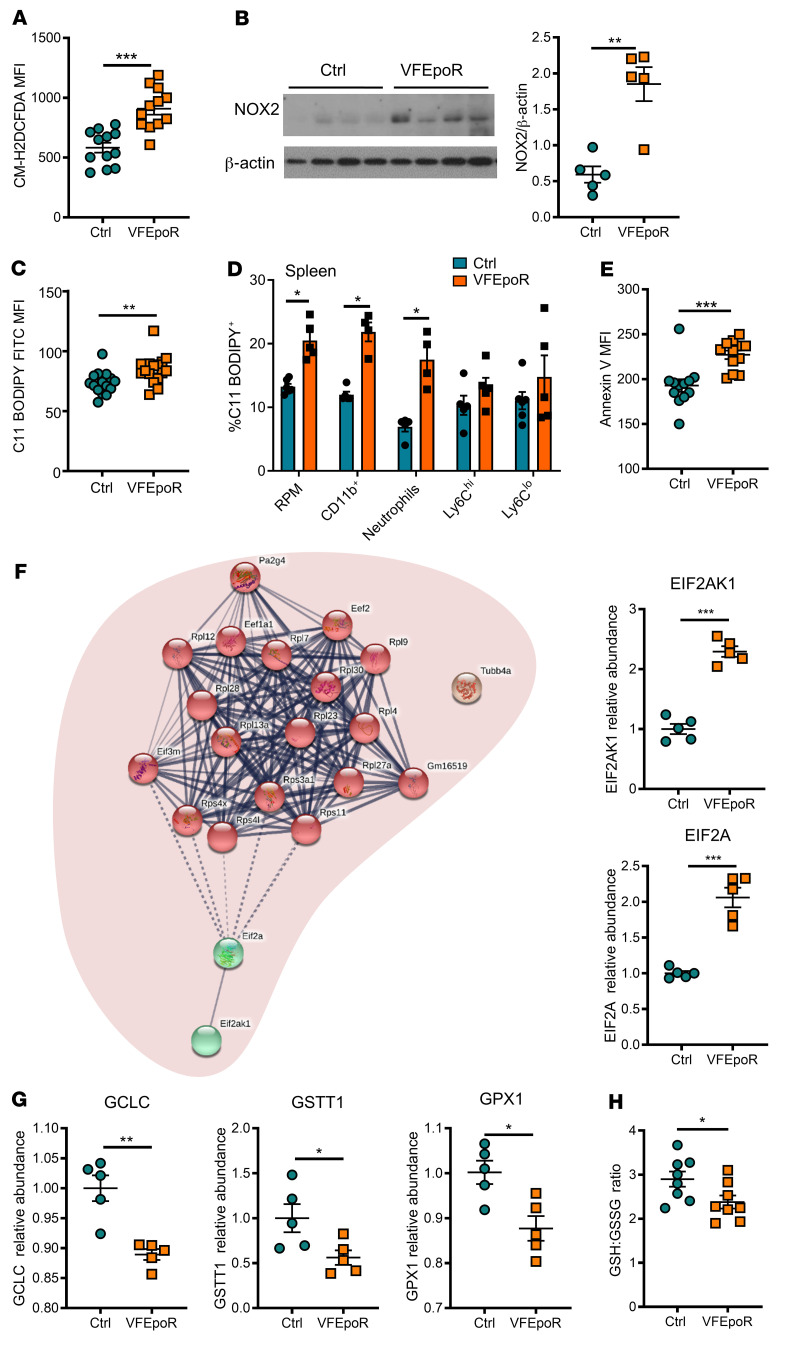
Figure 3. VFEpoR RBCs, red pulp macrophages, and splenic CD11b+ cells show increased ROS and lipid peroxidation.
Control and VFEpoR mice were fed a Western diet and treated with LDLR ASO and EPO (3 times per week) for 12 weeks. (A) ROS in RBCs was assessed by H2 DCFDA staining and analyzed by flow cytometry as MFI. (B) Immunoblot and quantification of NOX2 expression in RBC lysates, which was normalized to β-actin. (C) RBC lipid peroxidation was assessed by C11 BODIPY staining and quantified by flow cytometry as MFI. (D) Splenic red pulp macrophages, CD11b+ cells, neutrophils, and Ly6Chi and Ly6Clo monocytes were stained with C11 BODIPY for lipid peroxidation and analyzed by flow cytometry. (E) Assessment of externalized phosphatidylserine level by annexin V staining in RBCs through flow cytometry. (F) Interaction network and clustering of upregulated proteins in VFEpoR RBCs. Bar graphs show relative abundance protein level of EIF2AK1 (also known as heme-regulated inhibitor, HRI) and EIF2A (eukaryotic translation initiation factor 2A). The lines between proteins represent interactions among proteins with confidence level; dashed line is the lowest and thick line is the highest confidence. (G) Proteins involved in cellular oxidant stress were analyzed and quantifications of relative abundance of glutamate cysteine ligase catalytic subunit (GCLC), glutathione transferase theta 1 (GSTT1), glutathione peroxidase 1 (GPX1) are shown. (H) The level of reduced and oxidized glutathione ratio in RBCs. Unpaired 2-tailed t test, *P < 0.05, **P < 0.01, ***P < 0.001.

