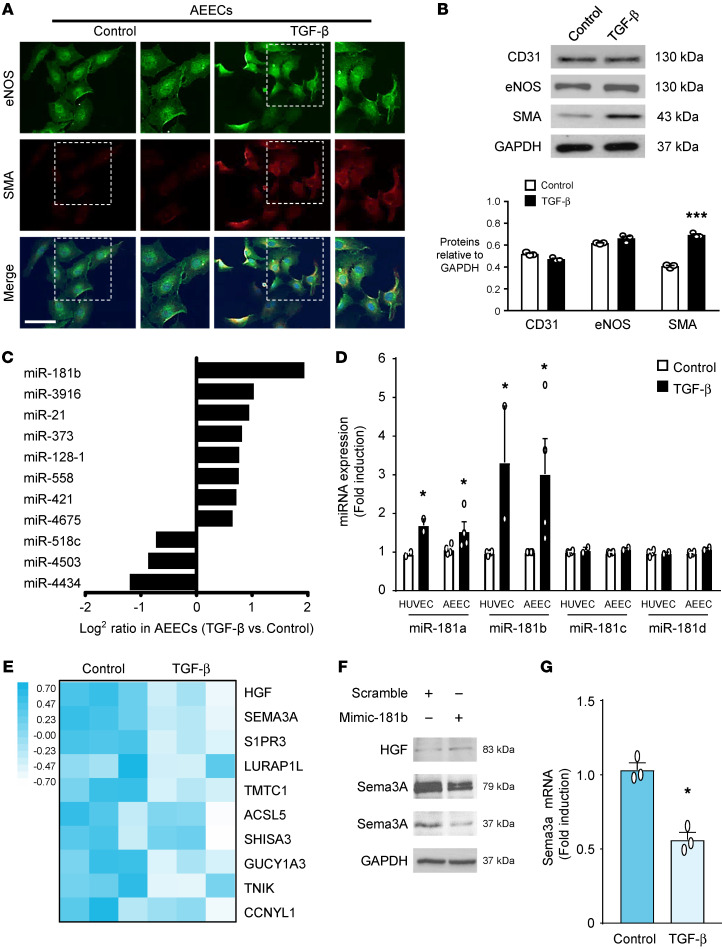
Figure 2. TGF-β induces EndMT and miR-181b expression and reduces Sema3A mRNA levels in human AEECs.
(A) Localization of SMA (red) and eNOS (green) (nuclear staining with DAPI is shown in blue). Scale bar: 75 μm. (B) Quantitative analysis with normalization to GAPDH. ***P < 0.001 versus the untreated group, by 2-tailed Student’s t test (n = 3). Western blotting shows the protein expression levels in AEECs treated with or without TGF-β 5ng/ml. (C) miR-181b expression was significantly higher in AEECs treated with TGF-β. (D) miR-181 gene profiles, as determined by qRT-PCR, with U6 used as the loading control (n = 3). The white bars represent ECs without TGF-β treatment, and the black bars represent cells treated with TGF-β. *P < 0.05 versus the control group, by 2-tailed Student’s t test. (E) Heatmap shows the top 10 genes downregulated in response to TGF-β and related to miR-181b with a minimum change of 1.5-fold and P < 0.05, by 2-tailed Student’s t test between the control and TGF-β groups. (F) AEECs were transfected with the miR-181b mimic (mimic-181b) or the scrambled control. Representative immunoblot of HGF and Sema3A expression. (G) Representative Sema3A mRNA levels with GAPDH used as the loading control. n = 3. *P < 0.05 versus the untreated group, by 2-tailed Student’s t test.

