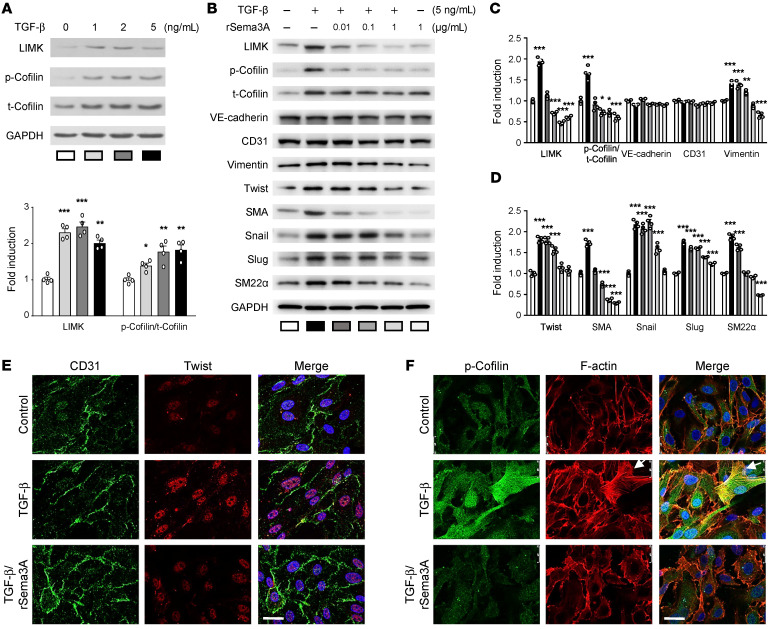
Figure 5. The effect of recombinant Sema3A on TGF-β–mediated induction of LIMK/p-cofilin signaling and EndMT.
(A) Immunoblots showing protein expression levels in AEECs treated with 0, 0.01, 0.1, or 1 ng/mL TGF-β with GAPDH as the loading control (n = 4) and densitometric quantification of protein expression following TGF-β treatment. *P < 0.05, **P < 0.01, and ***P < 0.001 versus the untreated group, by 1-way ANOVA with Dunnett’s post hoc test. (B–D) Representative immunoblots (B) and densitometric quantification (C and D) of protein expression. Data are presented as the mean ± SEM (n = 3). *P < 0.05, **P < 0.01, and ***P < 0.001 versus the untreated group, by 1-way ANOVA with Dunnett’s post hoc test. (E) Immunocytochemical analysis shows the localization of CD31 (green) and Twist (red). Scale bar: 25 μm. (F) Immunocytochemical analysis shows the localization of p-cofilin (green) and F-actin (red) (nuclear staining with DAPI is shown in blue). White arrows indicate lamellipodia and filopodia. Scale bar: 25 μm.

