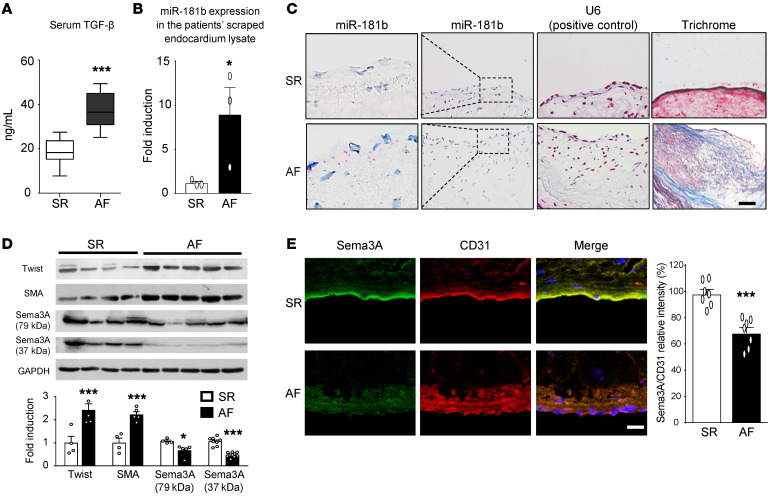
Figure 8. miR-181b and Sema3A expression in human AF.
(A) TGF-β serum levels in patients with AF or SR. Data are presented as the mean ± SEM; (n = 15). (B) qRT-PCR analysis of miR-181b in AEECs derived from the atrium of patients with AF or SR with U6 used as the loading control. Data are presented as the mean ± SEM (n = 3). (C) RNA CISH analyses of miR-181b in atrial tissue sections from patients with AF. miR-181b signal (red dots) and U6, used as a positive control (red color), were observed in the atrial endothelial edge in tissue, and trichrome staining showed miR-181b expression in the atrial subendocardial fibrotic tissue (n = 3) of these patients. Scale bar: 50 μm. Original magnification x400; enlarged insets x800. (D) Western blot analysis of Twist, SMA, and Sema3A in the atrium of patients with AF (n = 5) or SR (n = 4). Relative protein expression values were normalized to GAPDH. (E) Immunohistochemical analysis of Sema3A and CD31 in the endocardium (scale bar: 50 μm), and quantitation of Sema3A expression versus CD31 in the endocardium (n = 7 per group). All data are presented as the mean ± SEM. (A, B, D, and E) *P < 0.05 and ***P < 0.001 versus the SR group, by 2-tailed Student’s t test.

