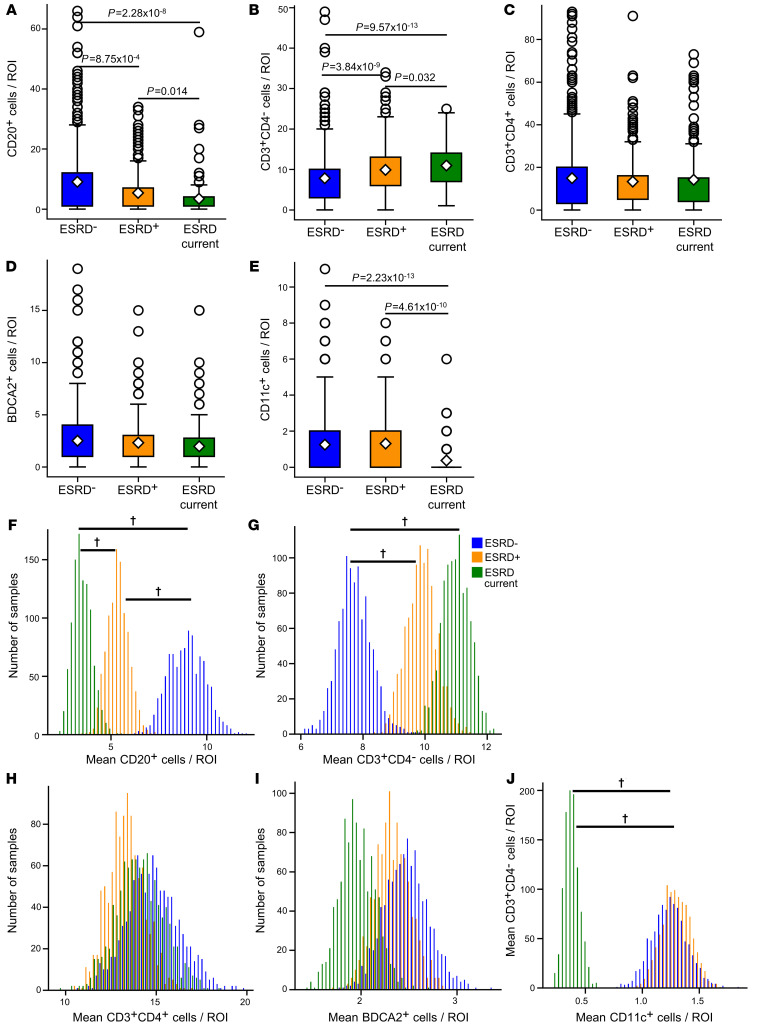
Figure 3. Local cell densities are associated with progressively worse renal outcomes.
Local cell density compared across ESRD– patients (n = 437 ROIs), ESRD+ patients (n = 266), and ESRD current patients (n = 162) for (A) CD20+ cells, (B) CD3+CD4– cells, (C) CD3+CD4+ cells, (D) BDCA2+ cells, and (E) CD11c+ cells. For all box plots, the population mean is represented by a white diamond, and quartile ranges are defined by the whisker boundaries and upper and lower box boundaries. Outliers are represented as open circles. All cell density comparisons were done with a Mann-Whitney U test with a Bonferroni’s correction for multiple comparisons, with significant P values noted. Bootstrapped sample means of ESRD– (blue), ESRD+ (orange), and ESRD current (green) ROIs for (F) CD20+ cells/ROI, (G) CD3+CD4– cells/ROI, (H) CD3+CD4+ cells/ROI, (I) BDCA2+ cells/ROI, and (J) CD11c+ cells/ROI. †95% confidence interval does not overlap with 0. The data set analyzed in this figure is the same as the data set introduced in Figure 2.

