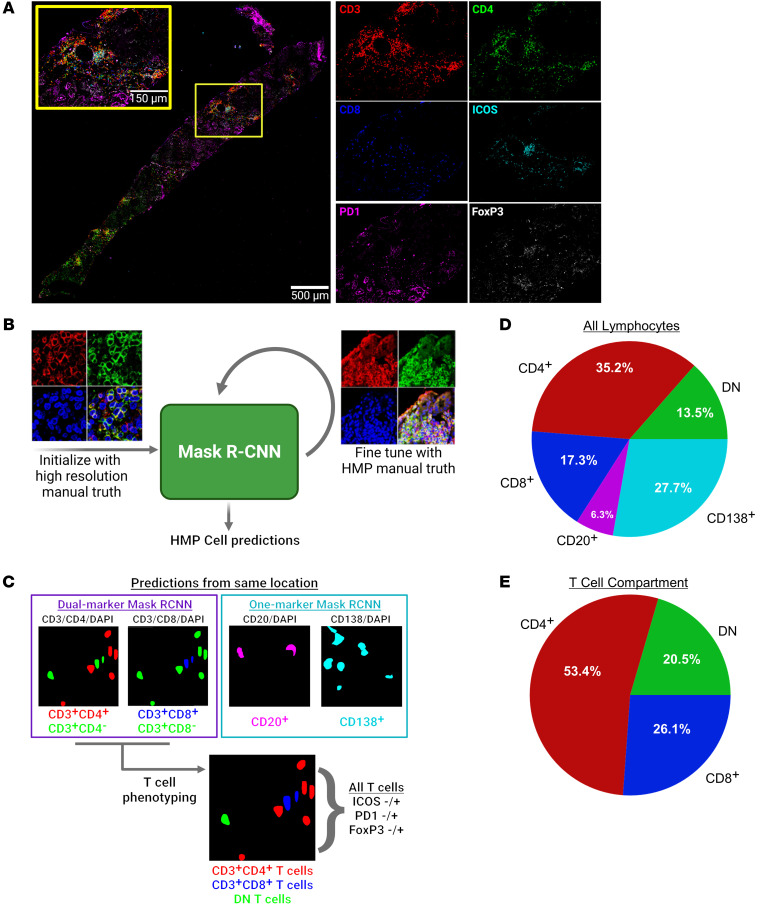
Figure 5. Cell detection, segmentation, and phenotyping in highly multiplexed fluorescence microscopy images.
(A) Representative composite of a full biopsy section, shown with merged and with isolated panels of CD3, CD4, CD8, ICOS, PD1, and FoxP3. Scale bar: 150 μm; 500 μm (inset). (B) Schematic of procedure for training and fine-tuning a Mask R-CNN for instance segmentation of cells in highly multiplexed microscopy images. High resolution, 63x, zoom factor=1.7 (left); multiplexing image: 63x, zoom factor=1 (right). (C) Dual-marker and single-marker cell predictions are used to establish base lymphocyte classes. All T cell predictions are further described by ICOS, PD1, and FoxP3 expression. (D) Breakdown of frequencies of the 5-base classes in the HMP data set. (E) Frequencies of CD4+, DN, and CD8+ T cells within the T cell compartment. Images in A–C were created with BioRender.com.

