Fig. 4.
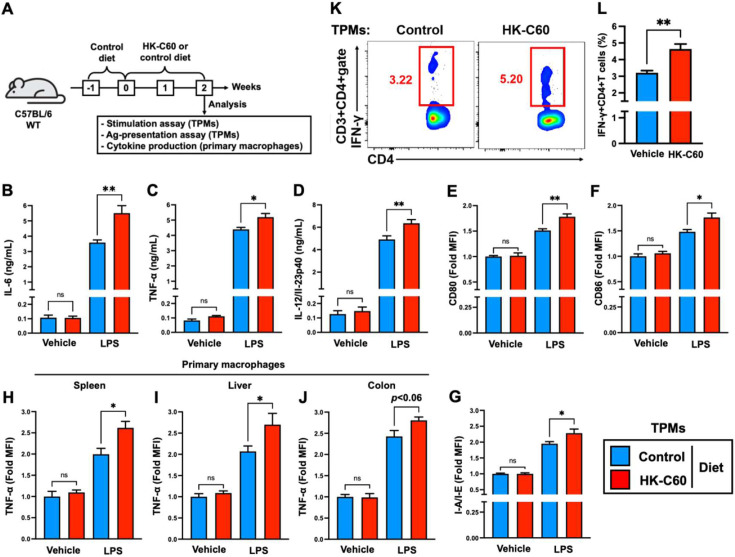
The HK-C60 diet enhances differentiated macrophage activity, leading to CD4+ T cell activation in an antigen-dependent manner.
A) Experimental design for the HK-C60 diet and immune activation assays. The mice were first fed the control diet for 1 week (habituation) and then received the HK-C60 or control diet for the next 2 weeks. TPMs were prepared from the mice in each group and used for each assay. Cytokine production was analyzed in primary macrophages of the spleen, liver, and colon. B–D) Cytokine production in macrophages. TPMs (1.0×10⁶/mL) were treated with LPS (100 ng/mL) or the vehicle control (PBS) at 37°C for 24 hr, and then the concentrations of IL-6 (B), TNF-α (C), and IL-12/IL-23p40 (C) in the cultured medium were measured by ELISA. E–G) Surface marker expression in macrophages. TPMs (1.0×10⁶/mL) were treated with LPS (100 ng/mL) or the vehicle control (PBS) at 37°C for 6 hr, and then the expression levels of CD80 (E), CD86 (F), and I-A/I-E (G) were analyzed by flow cytometry. H–J) Cytokine production in primary macrophages. The splenocytes, liver mononuclear cells, and colon LP cells were isolated from each mouse and treated with LPS (100 ng/mL) or the vehicle control (PBS) at 37°C for 6 hr in the presence of GolgiStopTM. The TNF-α production in macrophages was analyzed by flow cytometry. K, L) Antigen presentation assay for CD4+ T cells. TPMs (1.0×10⁷/mL) were co-cultured with splenic CD4+ T cells (2.0×10⁶/mL, isolated from OT-II mice) in the presence of OVA323-339 peptide (100 ng/mL) at 37°C for 24 hr. K) Representative image of IFN-γ+CD4+ T cells in flow cytometry analysis. L) Percentage of IFN-γ+CD4+ T cells calculated in the flow cytometry analysis. In the flow cytometry analysis, CD80, CD86, and I-A/I-E expression (E–G) and TNF-α production (H–J) were detected in the CD11b+F4/80+gate, and IFN-γ production (K, L) was detected in the CD3+CD4+gate. The cumulative data are shown as the mean ± SEM of six samples in two independent experiments. *p<0.05 and **p<0.01 were regarded as indicating significance, respectively. ns, not significant.

