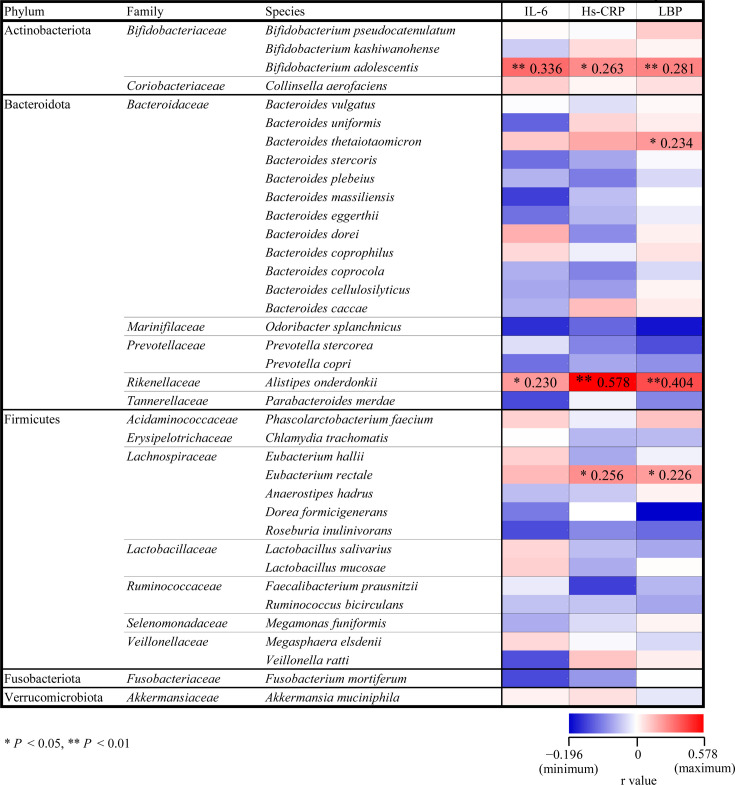
Fig. 2.
Heat map of Pearson correlation coefficients between inflammatory markers and relative abundances of gut microbial species. Red and blue columns indicate positive and negative correlations, respectively. Correlation coefficients are visualized by color gradient (blue, minimum < r < maximum, red). Columns with asterisks shows significant correlations (*p<0.05; **p<0.01).

