Fig. 4.

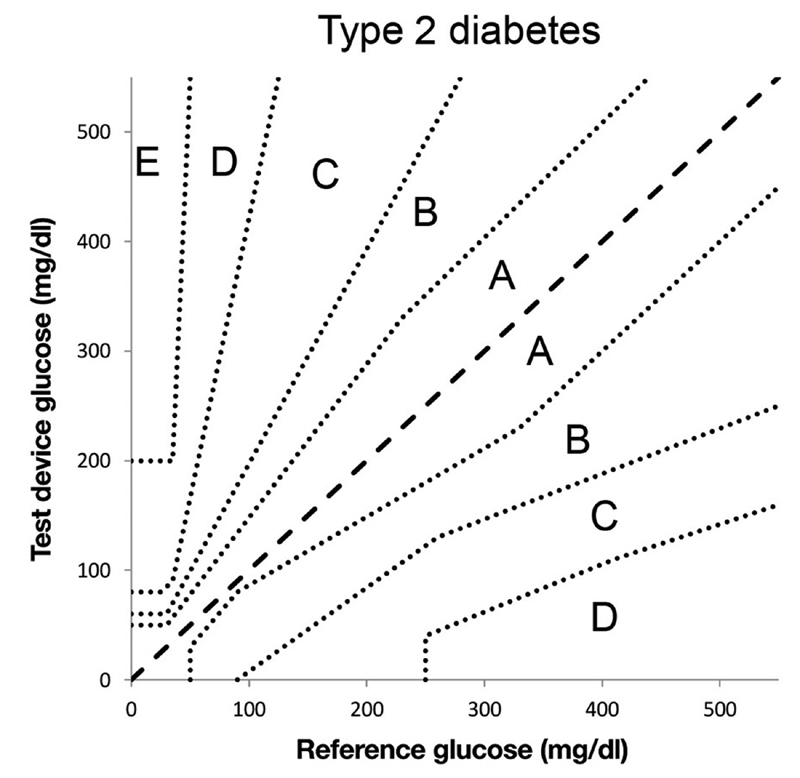
Parkes error grid . This grid assigns an error severity level from A to E (E high) based on the actual glucose level and the glucose level that is measured. We used forecasts in place of measurements. Image courtesy: Pfützner et al. 15

Parkes error grid . This grid assigns an error severity level from A to E (E high) based on the actual glucose level and the glucose level that is measured. We used forecasts in place of measurements. Image courtesy: Pfützner et al. 15