Fig. 5.

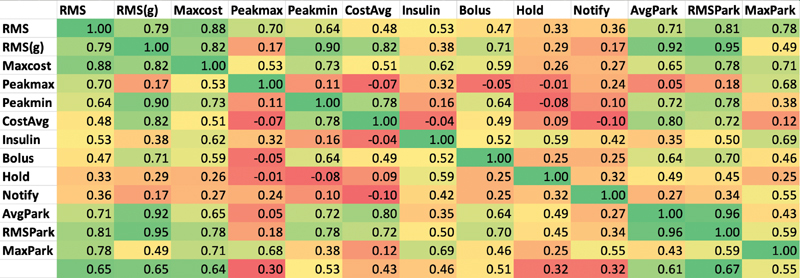
Correlation among the metrics . Pearson correlation coefficient among the metrics in Table 2 , colored on a scale from strong correlation (near 1) as green and poor or inverse correlation (0 and below) as red .

Correlation among the metrics . Pearson correlation coefficient among the metrics in Table 2 , colored on a scale from strong correlation (near 1) as green and poor or inverse correlation (0 and below) as red .