
Figure 3.
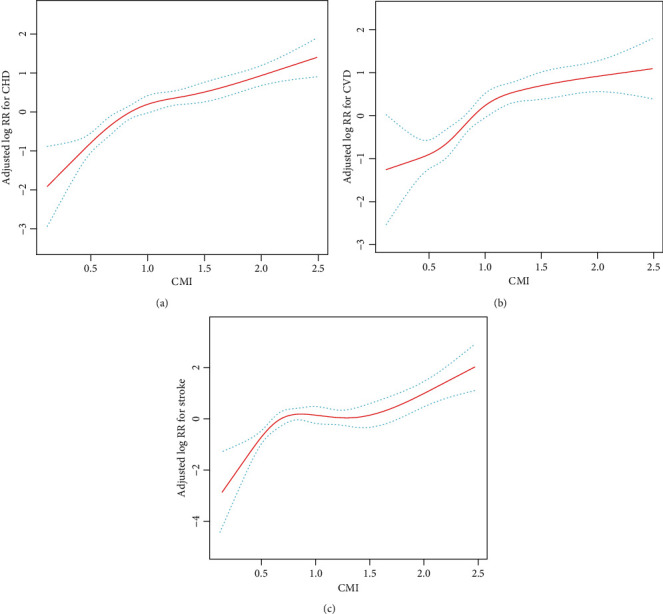
Smoothing curve revealing the effect of the cardiometabolic index on the risk of (a) cardiovascular disease, (b) coronary heart disease, and (c) stroke. ∗Adjusted for all noncollinear variables.
Official websites use .gov
A
.gov website belongs to an official
government organization in the United States.
Secure .gov websites use HTTPS
A lock (
) or https:// means you've safely
connected to the .gov website. Share sensitive
information only on official, secure websites.
Smoothing curve revealing the effect of the cardiometabolic index on the risk of (a) cardiovascular disease, (b) coronary heart disease, and (c) stroke. ∗Adjusted for all noncollinear variables.