Figure 2.

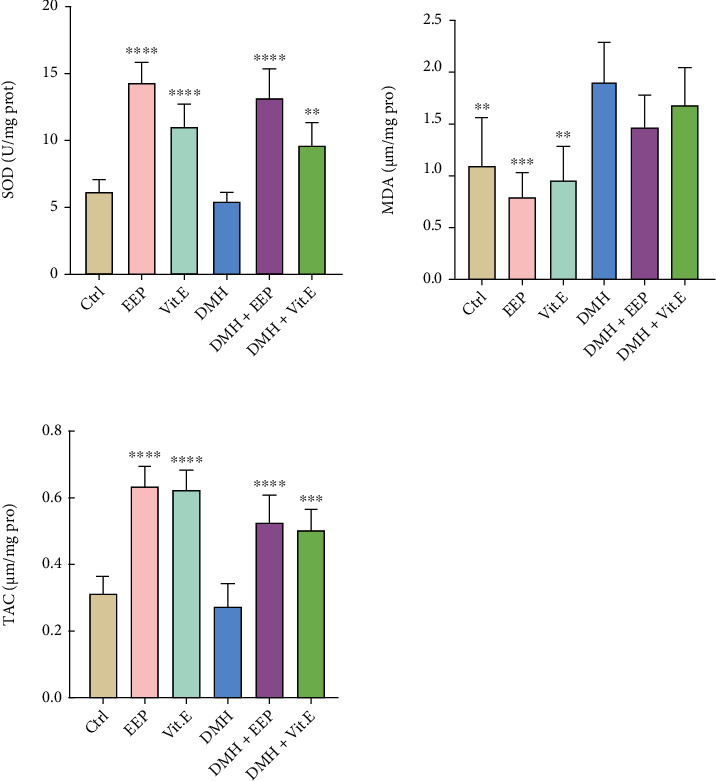
MDA, SOD, and TAC levels in the different groups. ∗∗P < 0.01, ∗∗∗P < 0.001, and ∗∗∗∗P < 0.0001: significant compared to the DMH group. All results are expressed as the mean ± standard deviation. n = 5.

MDA, SOD, and TAC levels in the different groups. ∗∗P < 0.01, ∗∗∗P < 0.001, and ∗∗∗∗P < 0.0001: significant compared to the DMH group. All results are expressed as the mean ± standard deviation. n = 5.