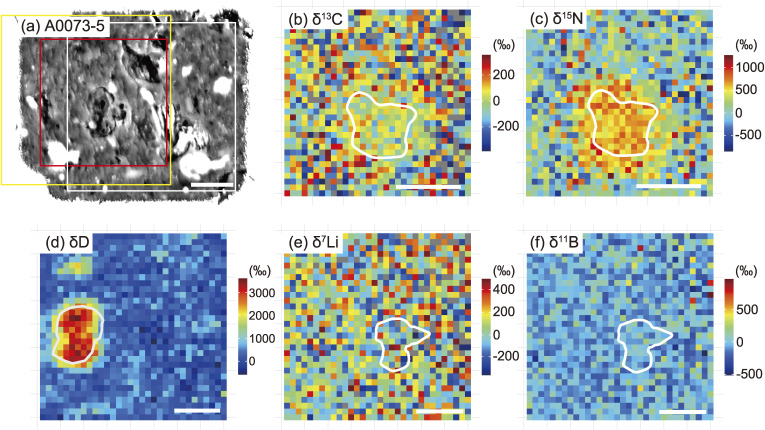
Figure 11.
C, N, H, Li, and B isotope maps of micro-OM in A0073-5. (a) BSE image. A 10 µm-sized dark object located in the center is the largest micro-OM in the area. The squares correspond to the regions where C and N (white), H (red), and Li and B (yellow) isotope maps were obtained. (b) C isotope map. The δ13C value of the largest micro-OM is 27 ± 69‰ (1SE). (c) N isotope map. The δ15N value of the largest micro-OM is 610 ± 78‰ (1SE). (d) H isotope map. The δD value of the largest micro-OM is 2983 ± 84‰ (1SE). (e) Li isotope map. The δ7Li value of the largest micro-OM is 29 ± 568‰ (1SE). (f) B isotope map. The δ11B value of the largest micro-OM is 0 ± 314‰ (1SE). The area corresponding to the largest micro-OM is outlined in (d), (e), and (f). The scale bar in each figure corresponds to 10 µm. Note that the shape of the largest micro-OM changed slightly because of spattering during analysis.

