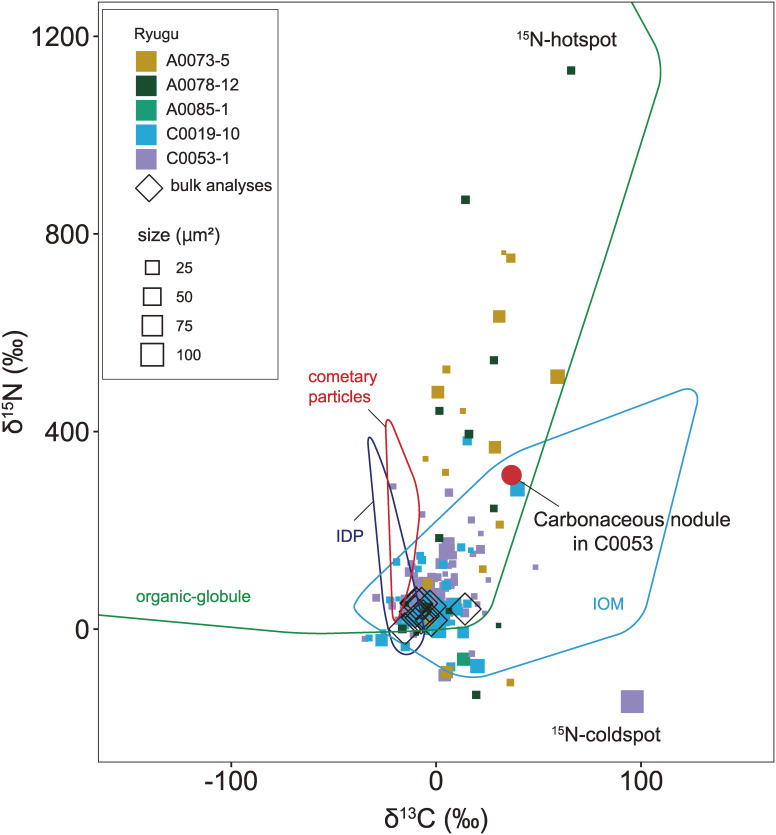
Figure 12.
C and N isotopic compositions (δ13C vs. δ15N) of micro-OM and a carbonaceous nodule. The size of the symbols is proportional to that of the object analyzed. The δ13C and δ15N values from bulk analyses (this study) and the ranges for IOM,33) IDP,106,202) cometary particles,203) and organic-globules107) are also shown.

