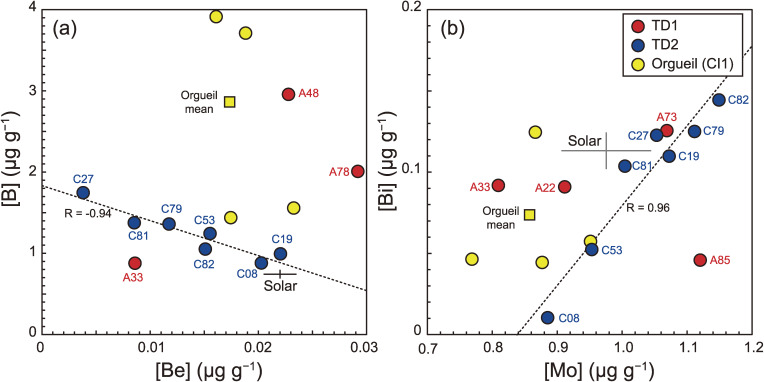
Figure 15.
(a) [Be] vs. [B] and (b) [Mo] vs. [Bi]. The broken lines represent the regression line for TD2 particles in (a) and (b). The yellow square represents the mean values of Orgueil (CI1) determined in this study. Cross is the Si-normalized solar abundance with a 1SD range are from Lodders.43) Note that the particle names have the first two zeros removed.

