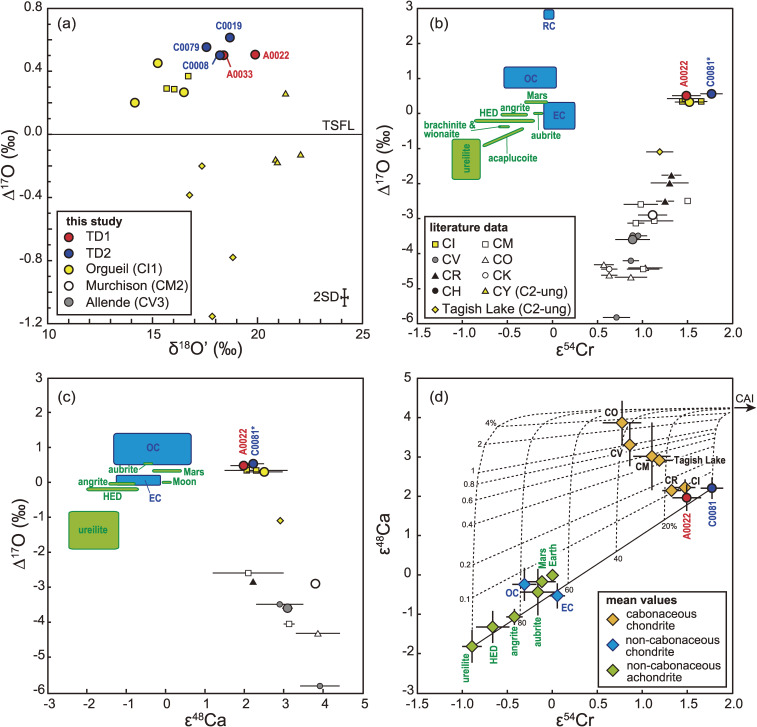
Figure 17.
(a) δ18O' vs. Δ17O, corresponding to the dashed rectangle in Fig. 8, (b) ε54Cr vs. Δ17O, (c) ε48Ca vs. Δ17O, and (d) ε54Cr vs. ε48Ca, with the values of terrestrial and extraterrestrial materials also included.55–61,79,190,191,193,194,207–230) *: Since the oxygen isotopic composition of C0081 was not determined, the average Δ17O of Ryugu was used for C0081. The error bars for data in this study and compiled data for carbonaceous chondrites from the literature are 2SE. The ranges of data for non-carbonaceous chondrites (OC, EC and RC) and achondrites are shown as blue and green areas in (b) and (c), where OC, EC, and RC denote ordinary, enstatite, and R chondrites, respectively. For other classes, error bars are either 2SE of an analysis (when only one analysis is available for a class), a range of two analyses (when only two analyses are available), or 1SD of the analyses (when more than three analyses are available). The solid line in (d) represents a mixing line between a highly thermally-processed disk reservoir (ureilite) and a disk reservoir that has experienced low thermal processing (C0081). Dashed lines in (d) represent mixing curves between CAI and the disk reservoirs, and the numbers represent the proportion of mixed CAI in percent. The Ca/Cr, ε54Cr, and ε48Ca values of CAI are 291, 6.2, and 4.3,231–235) respectively. The ε54Cr, and ε48Ca values of ureilite are −0.9 and −1.8, respectively. The Ca/Cr value of the ureilite-Ryugu mixture is fixed as 1.1 (the solar value) because the Ca/Cr of ureilite does not represent that of the parent body.236)

