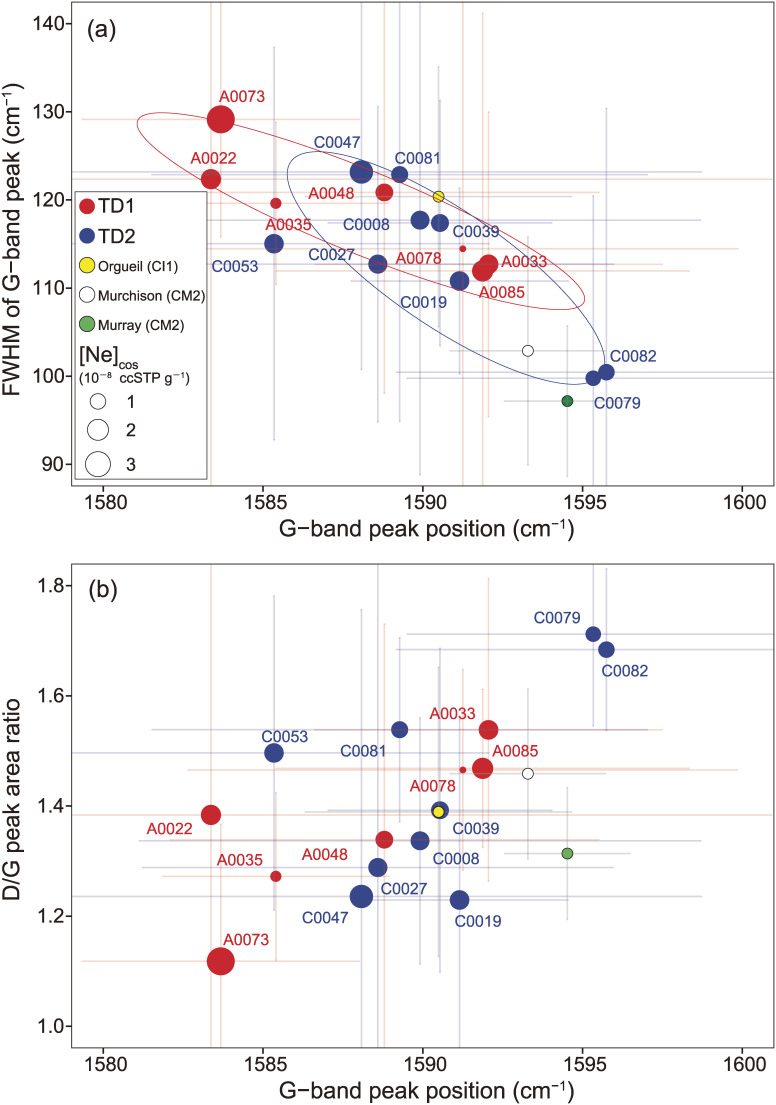
Figure 20.
Plots of the Raman peak parameters from Raman spectroscopy of Ryugu particles and Orgueil (CI1), Murchison (CM2), and Murray (CM2). (a) Peak position (cm−1) vs. FWHM (full width at half maximum) of the G-band peak, and (b) Raman shift peak position (cm−1) of the G-band vs. the D/G peak area ratio. The error bars are 1SE. In both diagrams, maker sizes for TD1 and TD2 are proportional to the mean [Ne] from cosmogenic (cos) component (in 10−8 ccSTP g−1) in each particle.

