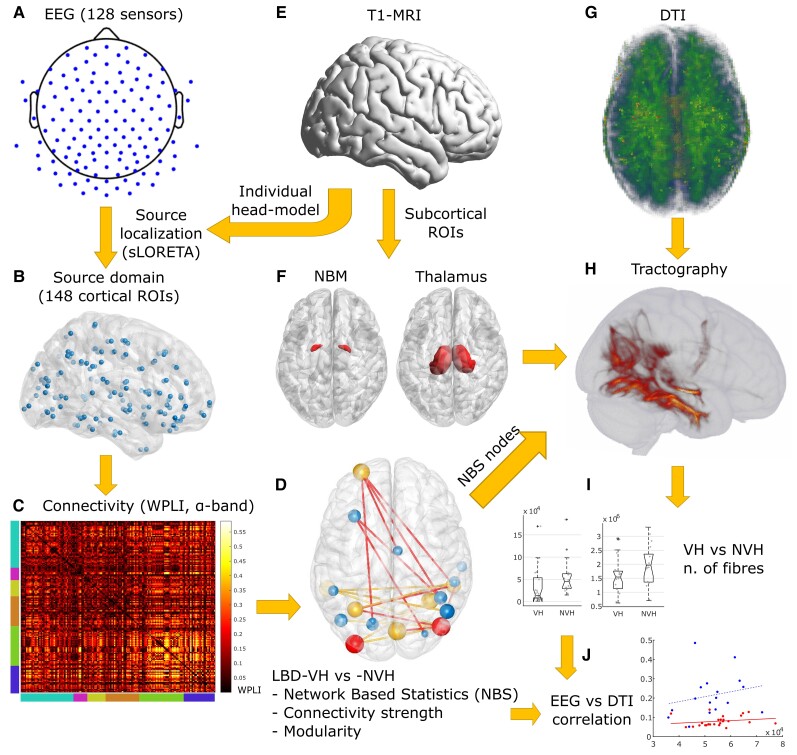
Figure 2.
Methodological workflow. (A) EEG-electrode distribution over the scalp. (B) Network nodes distribution within the cortex. (C) Example of a source-domain connectivity matrix in the α-band network of an NVH subject. Node distribution by regions is showed by bottom and left bar colours. From left to right: teal = frontal; magenta = insula; yellow = cingulate; orange = temporal; green = parietal; blue = occipital. (D) Output of NBS (for a description see Fig. 3). (E) Image of standard-MRI (Colin27). (F) NBM and thalamus regions of interest (ROIs) in the MNI space. (G) Example of a functional anisotropy map on a VH subject, projected to the MNI space. (H) Tractography output of a VH subject performed between NBS-detected and subcortical region of interest. (I) Distribution of number of streamlines in the thalamus-cortex and NBM-cortex white matter tracts. (J) WMNBS-WPLINBS distribution (for a description see Fig. 6).

