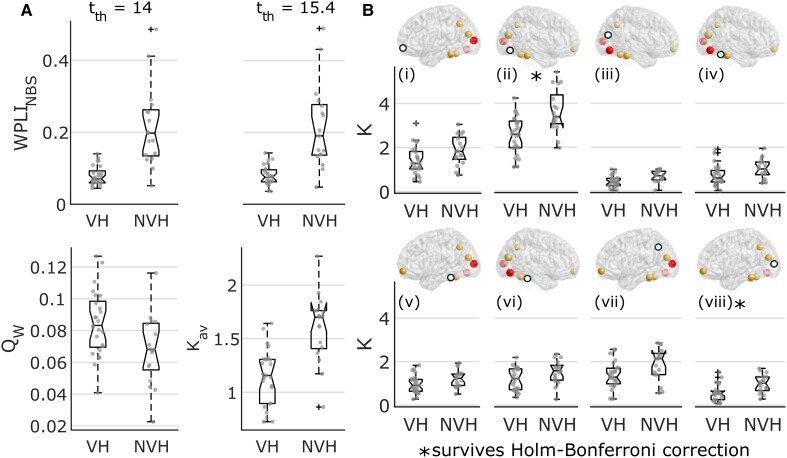
Figure 4.
Results from network strength analysis. (A) Distribution across groups for the average connectivity within the NBS component at two different statistical thresholds, modularity, and average node strength at the lowest statistical threshold (tth = 14); the VH group showed lower connectivity strength (WPLI) and higher network segregation (Qw) compared to the NVH group (Mann–Whitney U-tests, P < 0.05). WPLINBS = average WPLI within the NBS component; Qw = weighted modularity. (B) Individual node strength (K) distributions across groups of those nodes for which Mann–Whitney U comparison tests were significant (P < 0.05); node strengths were lower in the VH group compared to NVH; corresponding brain node for each figure is highlighted in teal; from the top left to the bottom right images: (i) left frontomarginal gyrus and sulcus; (ii) right inferior-occipital gyrus and sulcus; (iii) right cuneus; (iv) right lateral occipito-temporal gyrus; (v) left inferior-temporal gyrus; (vi) right inferior-temporal gyrus; (vii) left intraparietal sulcus; and (viii) left middle occipital sulcus and lunatus sulcus. In the box plots, whiskers extend to the most extreme data points not considered outliers. *Test survived Holm–Bonferroni correction. K = node strength.

