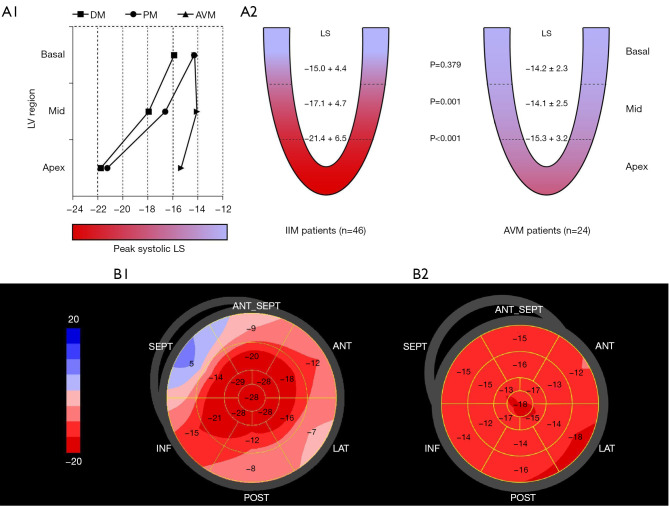
Figure 2.
Regional LS and differences between groups. Line graphs of DM, PM and AVM represented differences in regional basal, mid, and apical LS of left ventricle (A1). Mid and apical LS were significantly better in PM/DM patients (A2). Examples of bull’s-eye plots of peak systolic LS obtained from patients with PM/DM (B1) and AVM (B2). LV, left ventricle; DM, dermatomyositis; PM, polymyositis; AVM, acute viral myocarditis; LS, longitudinal strain; IIM, idiopathic inflammatory myopathy; PM/DM, idiopathic inflammatory myopathies.

