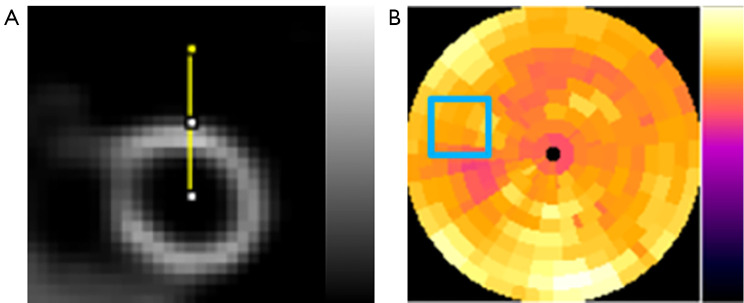
Figure 3.
The ROIs used for data analysis in this study. (A) 3D VOI chosen from denoised SPECT images for measuring NMSE and SSIM. The yellow line indicated the profile drawn across the cardiac wall for measuring the FWHM. (B) The CV value measuring from the selected ROI (blue box) on the polar plots. ROI, region-of-interest; VOI, volume-of-interest; NMSE, normalized mean square error; SSIM, structural similarity index; FWHM, full-width-at-half-maximum; CV, coefficient of variation.

