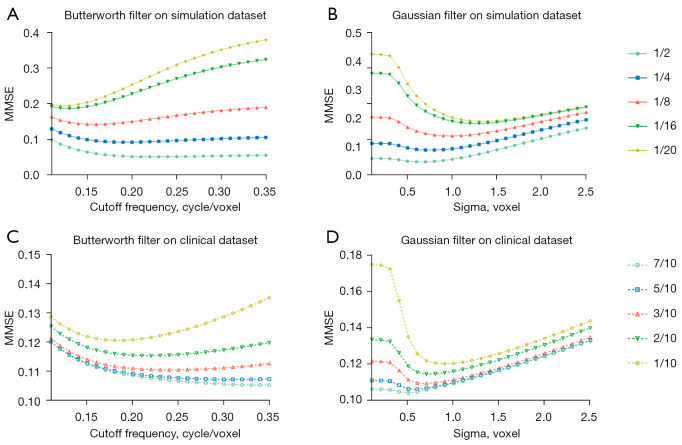
Figure 4.
The NMSE curves with various Ck from 0.11 to 0.35 cycle/voxel in the Butterworth filter and various σ from 0.1 to 2.5 voxels in the Gaussian filter, for 1/2–1/20 dose level of full dose SPECT reconstructed images on the phantom dataset (A,B) and for 7/10–1/10 dose level of full dose SPECT reconstructed images on the clinical dataset (C,D). NMSE, normalized mean square error.

