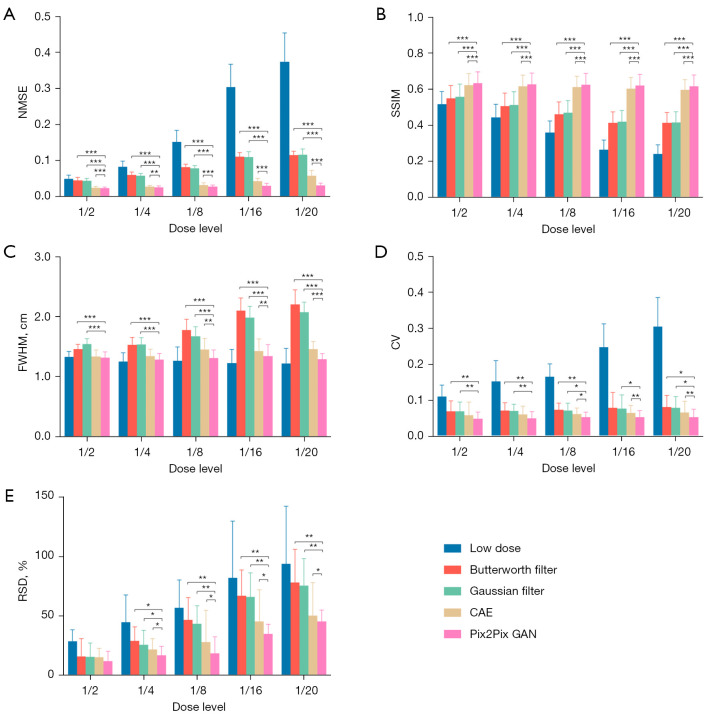
Figure 8.
The average (A) NMSE, (B) SSIM, (C) FWHM, (D) CV and (E) RSD measurements for different denoising methods for the simulation dataset. Error bars indicate the standard deviation of the respective indices for 20 phantoms. *, P<0.05; **, P<0.01; ***, P<0.001. NMSE, normalized mean square error; SSIM, structural similarity index; FWHM, full-width-at-half-maximum; CV, coefficient of variation; RSD, relative defect size differences; CAE, convolutional auto encoder; GAN, generative adversarial network.

